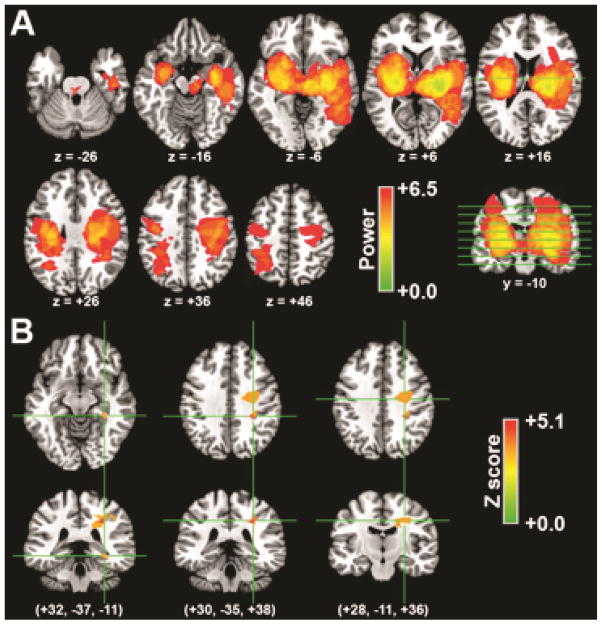
Figure 1. Acute hematoma locations associated with acute delirium.
(A) Colorization indicates power values for the ability to detect a significant relationship between acute delirium status and the presence of hematoma at each voxel. The indicated axial slices are marked by lines on the coronal slice. (B) Statistical nonparametric maps of the relationship between acute delirium status and hematoma location. Colorization indicates the voxel-wise Z score for the relationship, and only regions that survive P<0.05 FDR correction are shown. The left side of the image is the patient’s left (rather than the clinical convention).

