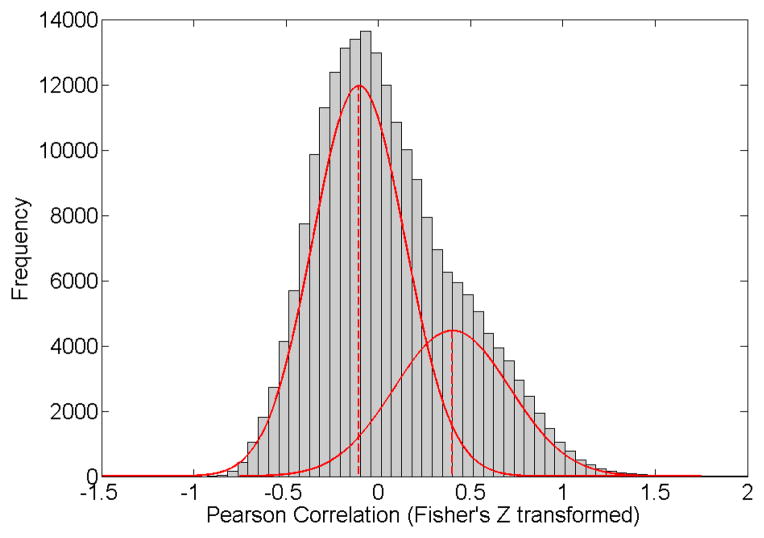
Figure 2.
Histograms of voxel pair functional connections (correlation via Fisher’s transformation) for two example subjects. The histograms demonstrate asymmetry due to the highly connected component in the right tail (the two components demonstrated in the figure are estimated by Gaussian mixture model). The two modes center at −0.1 and 0.8.

