Figure 3.
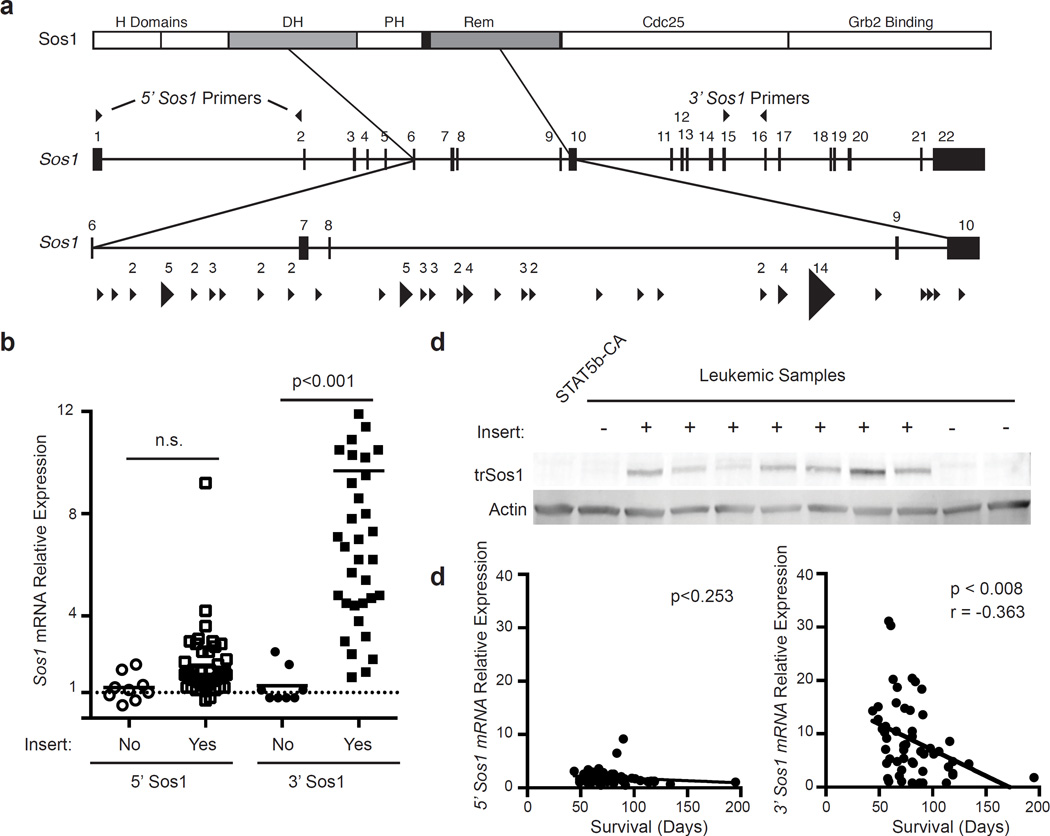
Identification of a truncated form of Sos1 that is over-expressed in leukemic cells. (a) Map of common insertion sites in the Sos1 gene. The top diagram illustrates the domains in the SOS1 protein. Arrow direction indicates the direction of the mapped transposon insertion and the size of the arrow is indicative of the number of mapped insertions at that specific site. The number above the arrow is the number of insertions at that site. The 5’ and 3’ primers used to quantitate 5’ and 3’ mRNA transcripts are indicated on the gene. (b) Sos1 mRNA levels were measured by real-time RT-PCR with primers from either the 5’ or 3’ end of the transcript. Open symbols represent primers in the 5’ region of Sos1 (Exons1–2) while filled symbols represent expression near the 3’ region of Sos1 (Exons 15–16). Values were normalized to expression of the gene of interest in Stat5b-CA progenitor B cells using Actin as an internal control. P-values were determined using a Kruskal-Wallace test. Lines represent means. (c) SOS1 truncated protein expression was examined by western blot. Controls are CD19+ splenic B cells from Stat5b-CA mice. The presence of a transposon insert is indicated by a plus sign. (d) Linear regression analysis of either 5’ or 3’ Sos1 transcript levels compared to survival.

