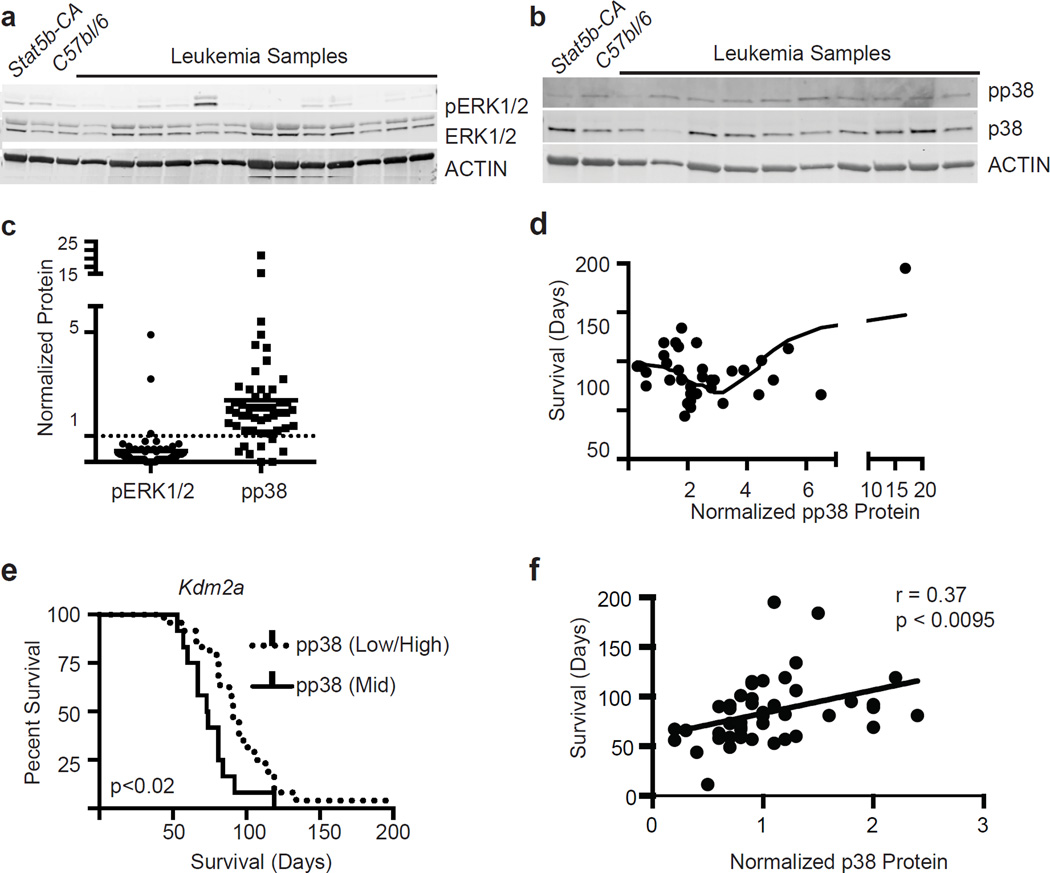
Figure 4.
Increased levels of pp38 but decreased phospho-ERK in leukemic cells. (a) Western blot analysis showing levels of pErk. (b) Western blot analysis showing levels of pp38. (c) Scatter plot summary of all western blotting data. There were 54 samples analyzed for pERK1/2 and 51 samples analyzed for pp38 expression. The samples were normalized to Stat5b-CA splenic B cell expression of each protein. Data were analyzed using a MannU-Whitney test; pERK and pp38 levels were all significantly different from controls, p<0.001. Lines represent means. (d) Plot showing the distribution of pp38 levels and survival. The line represents a second order polynomial fit to the data points. (e) Survival curves were generated by splitting mice into two groups based on pp38 expression – (group 1) 2–3 fold increase in pp38 levels (n=12), and (group 2) less than two or greater than 3 pp38 levels (n=24). A log-rank test was used to determine the p value. (f) Correlation of total p38 levels with survival. Correlation was calculated by computing r for p38 versus every survival using Pearson correlation coefficients.

