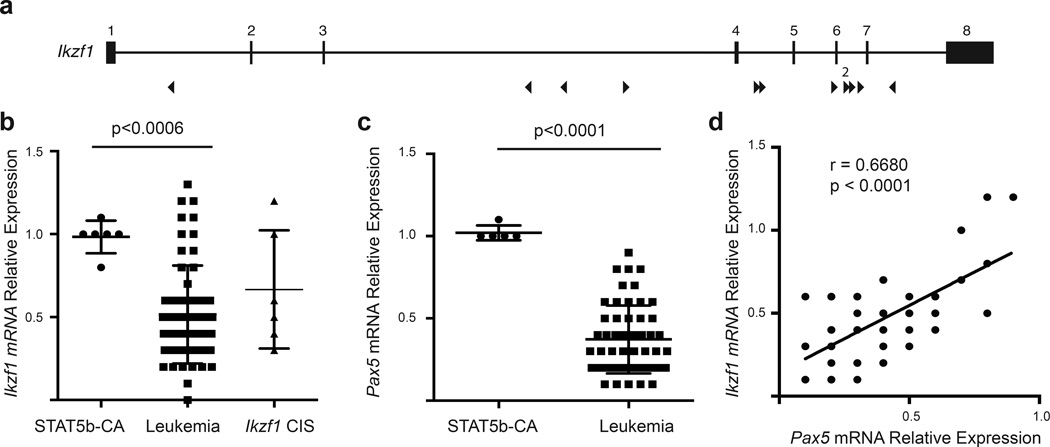
Figure 5.
Decreased expression of Ikzf1 and Pax5 transcripts in the leukemic cells. (a) Map of common insertion sites in the Ikzf1 gene. Arrow direction indicates the direction of the mapped transposon insertion and the size of the arrow is indicative of the number of mapped insertions at that specific site. The number above the arrow is the number of insertions at that site. (b) Ikzf1 mRNA expression. These results represent 6 Stat5b-CA replicates and 57 leukemic samples. Ikzf1 Cis column shows the Ikzf1 expression for just those samples with transposon insertions. (c) Pax5 mRNA expression. These results represent 5 Stat5b-CA replicates and 54 leukemic samples. p-values were calculated using MannU-Whitney test. Lines in panels b and c represent means ± standard deviation. (d) Correlation of Ikzf1 and Pax5 expression. Correlation was calculated by computing r for Pax5 versus every Ikzf1 using Pearson correlation coefficients.

