Figure 7.
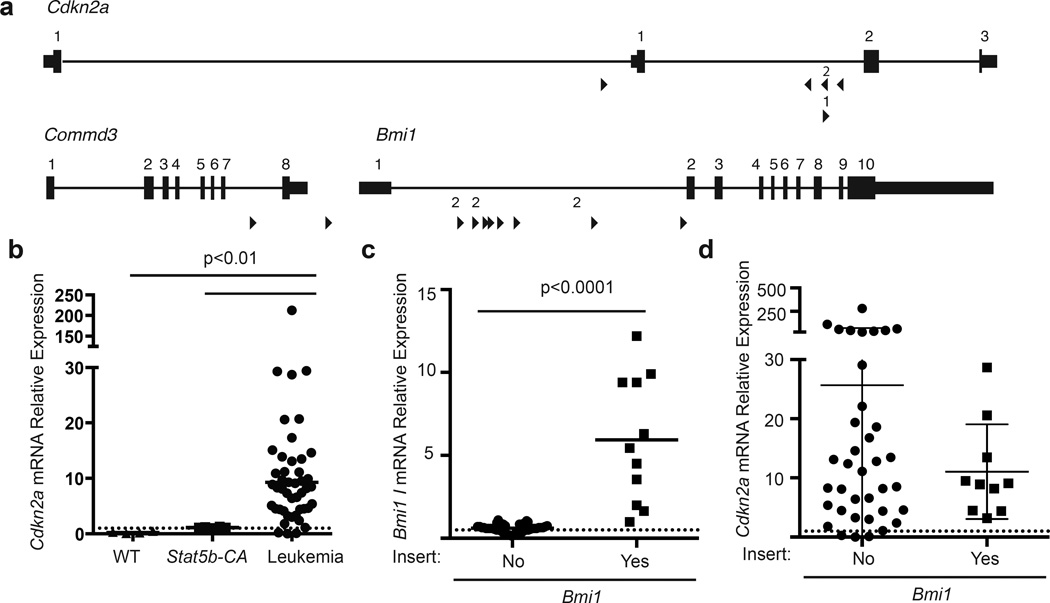
Role of Bmi1 and Cdkn2a in leukemia. (a) Map of common insertion sites in the Bmi1 and Cdkn2a genes. Arrow direction indicates the direction of the mapped transposon insertion and the size of the arrow is indicative of the number of mapped insertions at that specific site. The number above the arrow is the number of insertions at that site. (b) Cdkn2a mRNA expression in leukemic or progenitor B cells from control mice. Line represents mean of the samples. This analysis includes 4 C57bl/6 (WT), 6 Stat5b-CA and 55 leukemic samples; Cdkn2a levels were significantly higher (p<0.01) in leukemic samples than WT or Stat5b-CA samples; p-values were calculated by Kruskal-Wallace test. (c) Bmi1 mRNA expression. Bmi1 expression is based on 47 leukemic samples with 10 samples containing a transposon insertion. Line represents mean of the samples and p-values were calculated using MannU-Whitney test. (d) Comparison of Cdkn2a expression in mice with or without a transposon insertion in the Bmi1 gene. Error bars represent the standard deviation and p-values were calculated using MannU-Whitney test.

