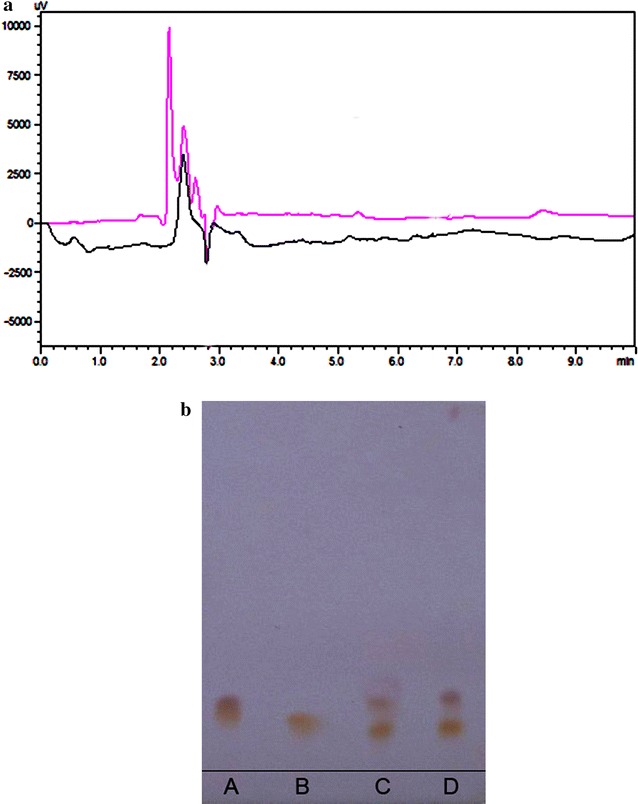
Fig. 6.

a It represents the chromatogram of control and sample treated with pure LA; b HPTLC analysis of hydrolysates of l-asparaginase enzyme. From left: A aspartic acid, B asparagine, C mixture (aspartic acid + asparagine), and D treated sample with LA
