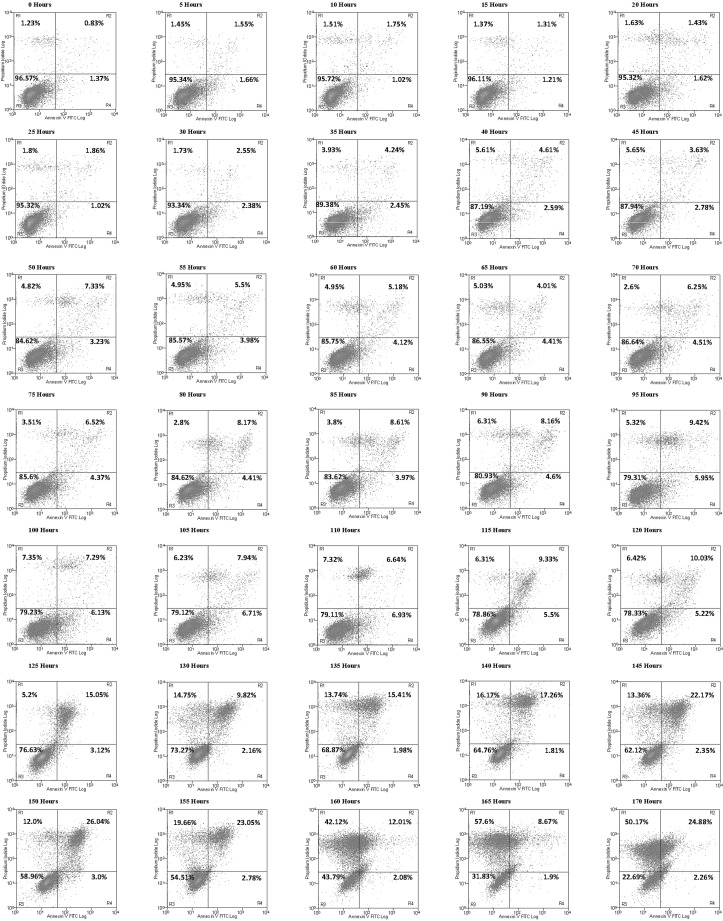
Fig. 3.
Automated online flow cytometric analyses of CHOK1SV cells. Quadrant plots were generated every 5 h between 0 and 170 h. The x-axis represents Annexin-V-FITC fluorescence and the y-axis PI fluorescence with the plot divided into four representative regions labeled R1–R4. R1 = necrotic cells, R2 = late-apoptotic cells, R3 = viable cells, R4 = early-apoptotic cells. The data show that these CHO cells enter early apoptosis and progress to late apoptosis in the plots as the CHO culture progresses, with time, until reaching a point where late apoptosis and eventually necrosis dominates. In this study, the importance of entering early apoptosis is key, as this gives an early indicator of negative environmental factors an indication of when to harvest the cells depending on the tolerance of the product to the percentage of early and late apoptosis within the culture or serve as an early indicator for process adjustments (nutrient feeds or the activation of apoptosis suppressors) to compensate for the negative environmental stimuli

