Figure 2.
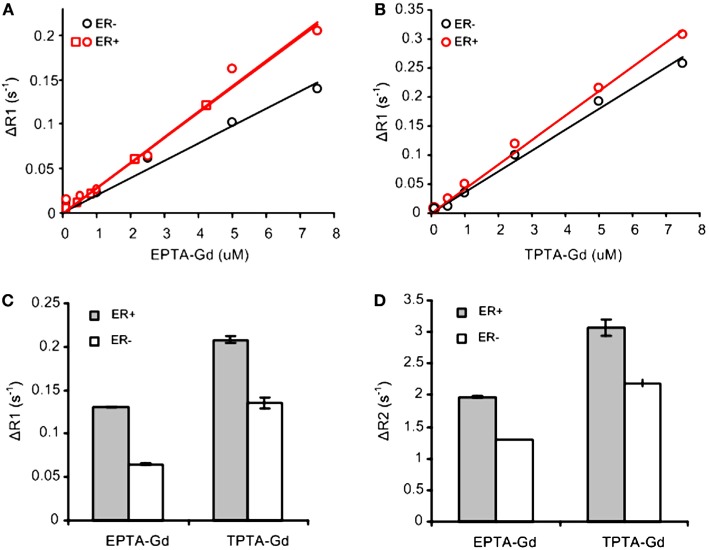
T1 and T2 measurements with EPTA-Gd and TPTA-Gd in perfused ER-positive and ER-negative MDA-MB-231 human breast cancer cells. ΔR1 and ΔR2 are defined as the difference between R1 (or R2) of cells perfused with medium containing the contrast agent and R1 (or R2) of these cells perfused with contrast-free medium. (A) T1 relaxivity of EPTA-Gd in ER-positive and negative cells: r1 (ER-positive) = 28.5 ± 0.1 mM−1s−1 (n = 2) and r1 (ER-negative) = 19.6 mM−1s−1. (B) T1 relaxivity measurements of TPTA-Gd in ER-positive and negative cells: r1 (ER-positive) = 42.1 mM−1s−1 and r1 (ER-negative) = 36 mM−1s−1. The cells were perfused in the NMR tube and treated with increasing concentrations of each contrast agent. T1-relaxation time of water protons was determined at 9.4 T using inversion recovery pulse sequence. Different symbols for ER-positive cells in (A) represent two independent experiments. r1 relaxivities were calculated as the slope of the linear fit to the data as explained in the text. (C) Change in T1-relaxation rates, ΔR1, in the perfused cells after washing out EPTA-Gd (7.5 μM) or TPTA-Gd (7.5 μM) from the perfusion system with fresh medium. (D) Change in T2-relaxation rates, ΔR2, in the perfused cells as in (C). Data presented in (C,D) are mean ± SD of three to six measurements recorded 30–60 min after the beginning of the washout process.

