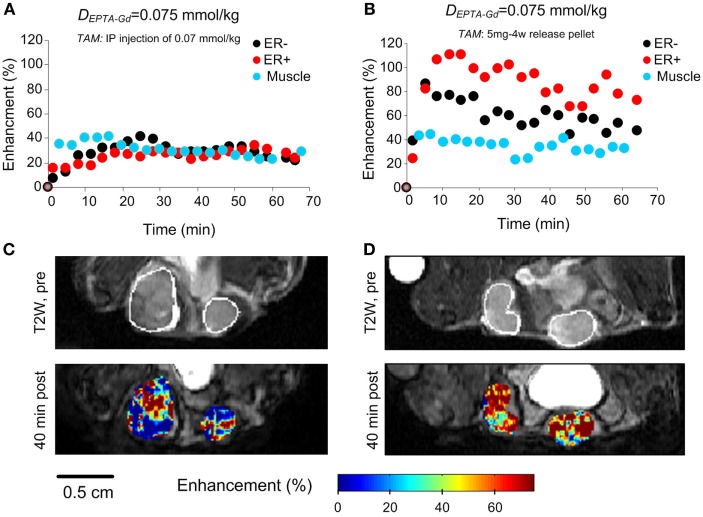
Figure 9.
EPTA-Gd induced enhancement patterns (A,B) and enhancement maps at 40 min (C,D) in ER-positive and ER-negative MDA-MB-231 xenografts treated with acute (1 h) and chronic (3 days) tamoxifen. The anatomy of the xengorafts is demonstrated in the T2-weighted images (C,D). The enhancement maps are overlaid on the corresponding T1-weighted images.

