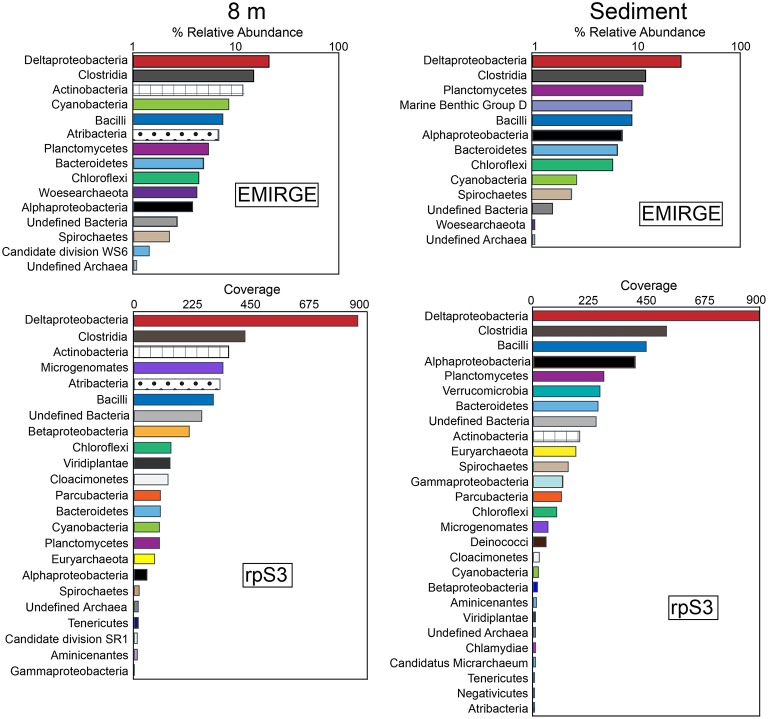
Figure 2.
Rank-abundance curves of EMIRGE 16S rRNA sequences and ribosomal protein S3 (rpS3) sequences from the 8 m and sediment metagenomes. The relative abundance of 16S rRNA genes was calculated with EMIRGE (Miller et al., 2011). The rank abundance curves for rpS3 sequences are based on average depth of coverage of the contig where each rpS3 sequence was encoded. Bars represent the sum of the relative abundance of taxonomic groups (at the phylum level except for Proteobacteria and Firmicutes which are summed at the class level).

