Figure 9.

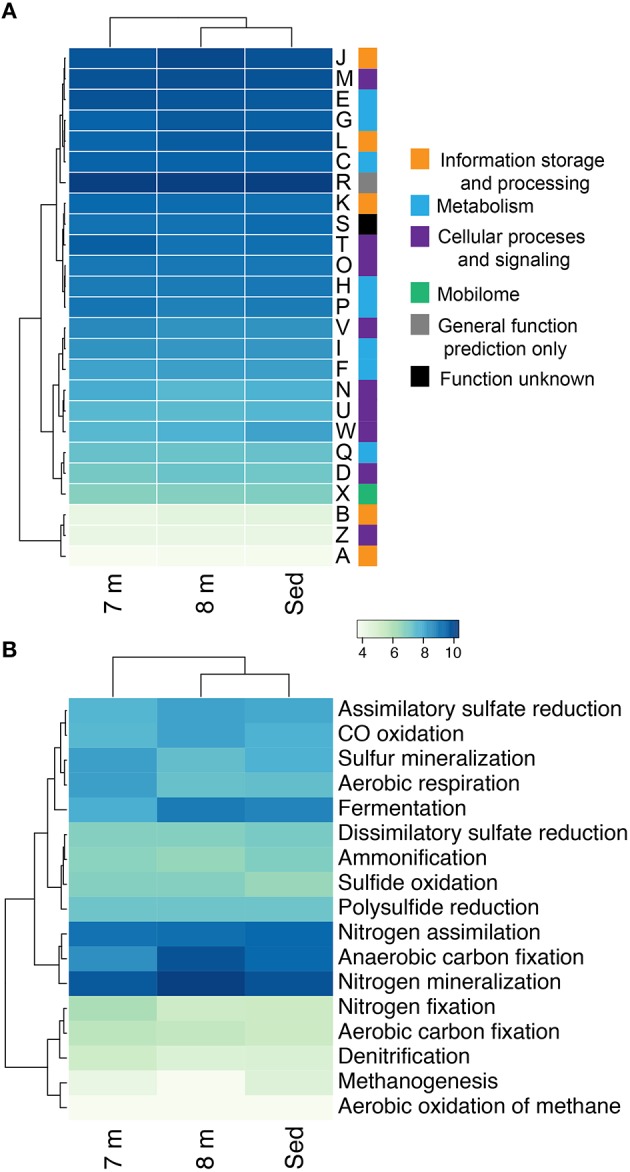
Hierarchical clustering of the relative abundance of COG categories (A) and the genetic potential for carbon, nitrogen, and sulfur cycling in each assemblage at 7, 8 m, and in the sediments of Mahoney Lake (B). Values within each category are normalized across samples (see Section Materials and Methods). Clustering analyses is based on the normalized abundance profiles of COGs. The genetic potential for each step in (B) was estimated using a combination of normalized marker gene ratios as previously described (Lauro et al., 2011). Marker genes are provided in Table S4. The 7 m data set is from Hamilton et al. (2014). Sed, Sediment; A, RNA processing and modification; B, chromatin structure and dynamics; C, energy production and conversion; D, cell cycle control, cell division, chromosome partitioning; E, amino-acid transport and metabolism; F, nucleotide transport and metabolism; G, carbohydrate transport and metabolism; H, coenzyme transport and metabolism; I, lipid transport and metabolism; J, translation, ribosomal structure, and biogenesis; K, transcription; L, replication, recombination, and repair; M, cell wall/membrane/envelope biogenesis; N, cell motility; O, post-translational modification, protein turnover, chaperones; P, inorganic ion transport and metabolism; and Q, secondary metabolites biosynthesis, transport, and catabolism; R, general function prediction only; S, function unknown; T, signal transduction mechanisms; U, intracellular trafficking, secretion, and vesicular transport; W, extracellular structures; X, nuclear structure; V, defense mechanisms; Z, cytoskeleton.
