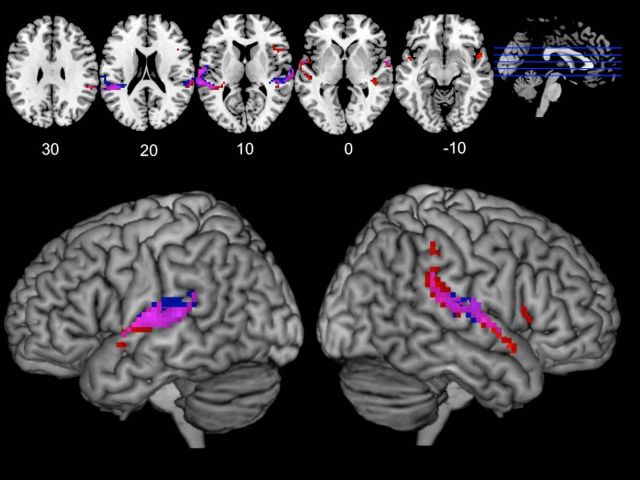
Figure 2.
Cortical regions more active during synchronous speaking than solo speaking and listening, shown for Synch-Live and Synch-Rec separately. This conjunction analysis shows voxels more active during synchronous speaking, displaying activation for Synch-Live and Synch-Rec separately. Voxels in red represent significant voxels (p < 0.005, cluster corrected) for Synch-Live. Blue voxels represent significant voxel for Synch-Rec. Purple voxels represent significance in both conjunctions. Activated regions were largely overlapping, although activity in right inferior frontal gyrus was only detected for the Synch-Live condition. A statistical test for differences between Synch-Live and Synch-Rec is reported in the next section.

