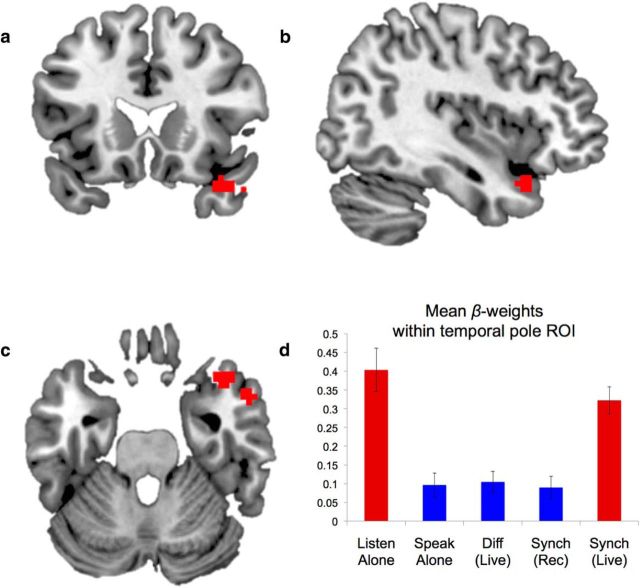
Figure 5.
Release of auditory suppression during live synchronous speaking. Red voxels represent increased activity during speech that is produced synchronously with a live person (a–c) as defined by the conjunction of Synch-Live > Synch-Rec ∩ Synch-Live > Diff-Live. The profile of activity in this region (d) indicates that this activity reflects an absence of suppression that typically occurs during speech production. The conditions are colored to indicate significant differences: red bars are significantly greater than blue bars; bars of the same color did not differ significantly. Significance was set at a Bonferroni-corrected level of α = 0.005 for all 10 pairwise tests. Error bars indicate SEM.

