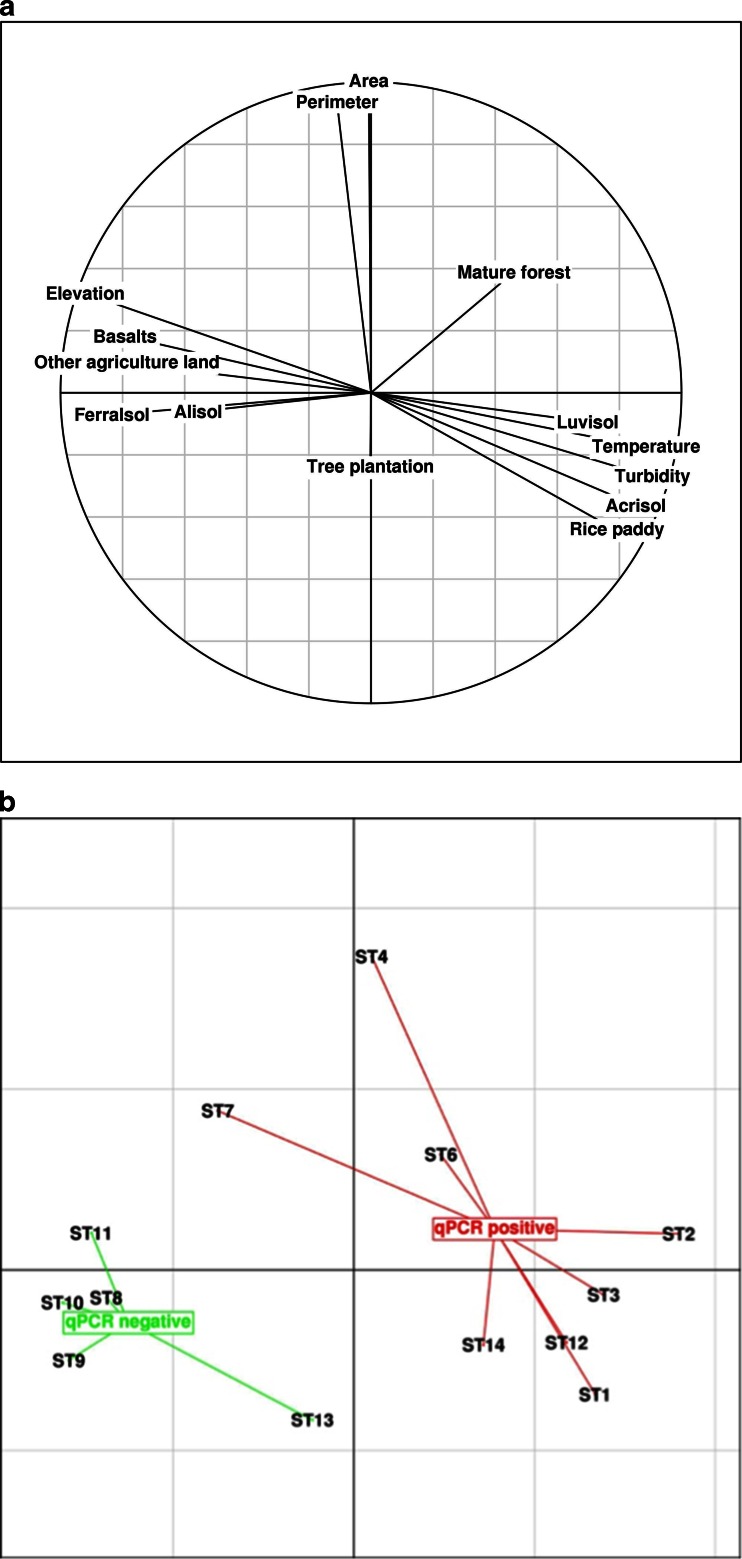
Fig. 4.
Correlation circle and factorial map from the first two axes for the main variables (VIP > 1) from partial least square analysis (PLSDA). a Correlation circle; b Factorial map. qPCR positive and negative samples are reported in red and green, respectively. Each sample is connected to the barycenter of each group of point

