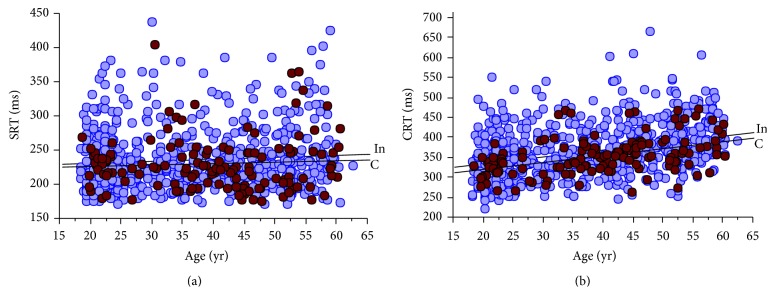
Figure 2.
The change in RT with age. (a) shows there was no association in SRT with age for the control participants (controls (C) = darker circles; n = 135; y = 221.4 + 0.20∗x; p = 0.478) while there was a weak positive association for the intervention participants (intervention (In); n = 641; y = 224.9 + 0.28∗x; p = 0.038). (b) shows there were significant positive associations in CRT with age for both the control (controls (C) = darker circles; n = 135; y = 285.4 + 1.74∗x; p < 0.0001) and intervention participants (intervention (In); n = 643; y = 301.7 + 1.61∗x; p < 0.0001).

