Figure 5.

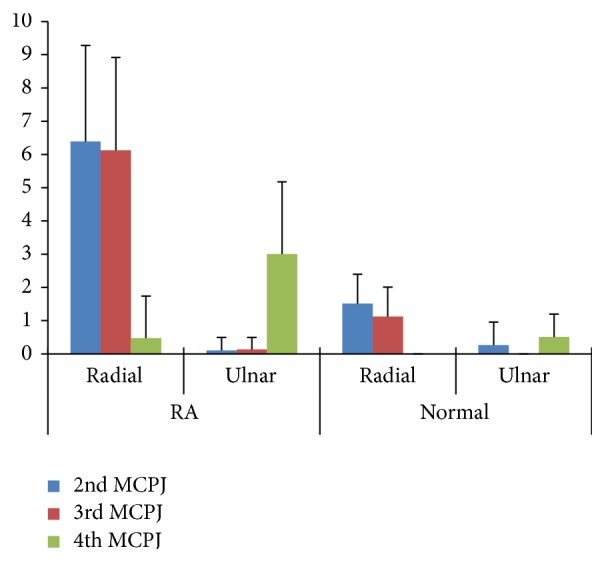
Box plot presentation of synovial thickness distribution of 2nd, 3rd, and 4th MCPJ in RA patients and healthy control group.

Box plot presentation of synovial thickness distribution of 2nd, 3rd, and 4th MCPJ in RA patients and healthy control group.