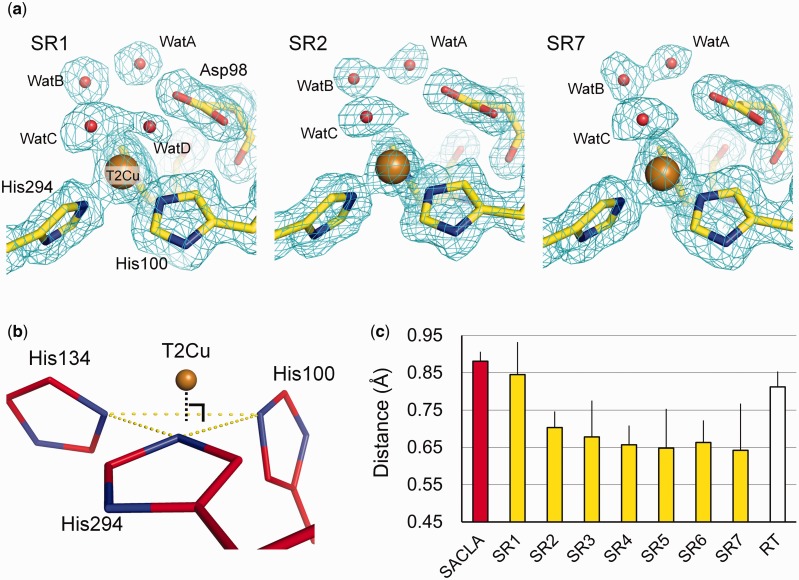
Fig. 1.
Structural changes in SRX. (a) Changes in the hydration structures at the T2Cu site. The 2Fo–Fc maps contoured at 1.0 σ are shown as cyan meshes. Carbon, oxygen, nitrogen and copper atoms are yellow, red, blue and brown, respectively. (b) The ligand plane composed of three Nε2 atoms of His residues at the T2Cu site (yellow-dashed lines). Carbon, nitrogen and copper atoms are coloured in bright red, blue and brown, respectively. (c) Distances from T2Cu to the ligand plane. The error bars represent twice the values of the coordinate errors estimated by the maximum likelihood method. (A colour version of this figure is available online at: http://jb.oxfordjournals.org)

