Figure 1.

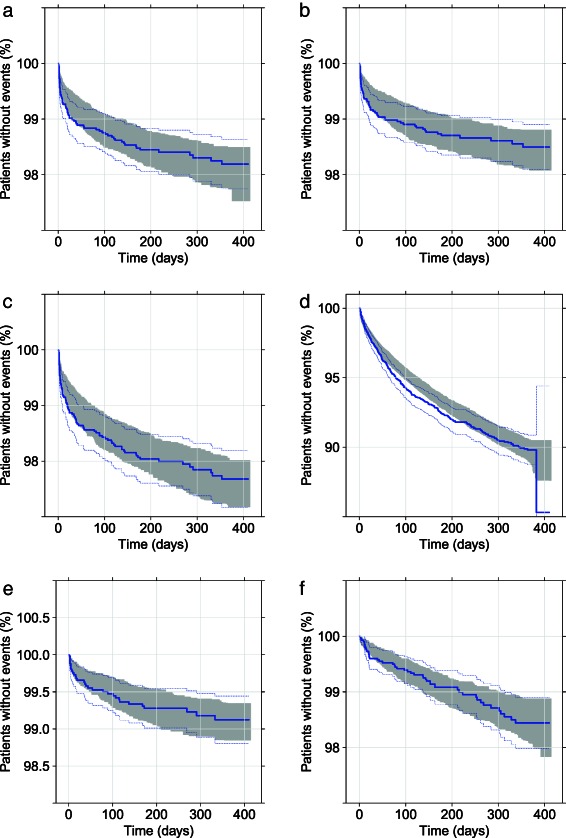
Visual predictive check of edoxaban final exposure‐response model (a) recurrent venous thromboembolism (VTE); (b) composite of deep vein thrombosis (DVT) and nonfatal pulmonary embolism (PE); (c) composite of DVT, nonfatal PE, and all‐cause mortality; (d) clinically relevant bleeding; (e) all death; and (f) major adverse clinical event (MACE). Solid line represents the Kaplan–Meier estimate of the observed data, dotted line represents the 95% confidence intervals of the observed data, and the shaded area represents the 95% prediction intervals using the final exposure‐response model for each endpoint.
