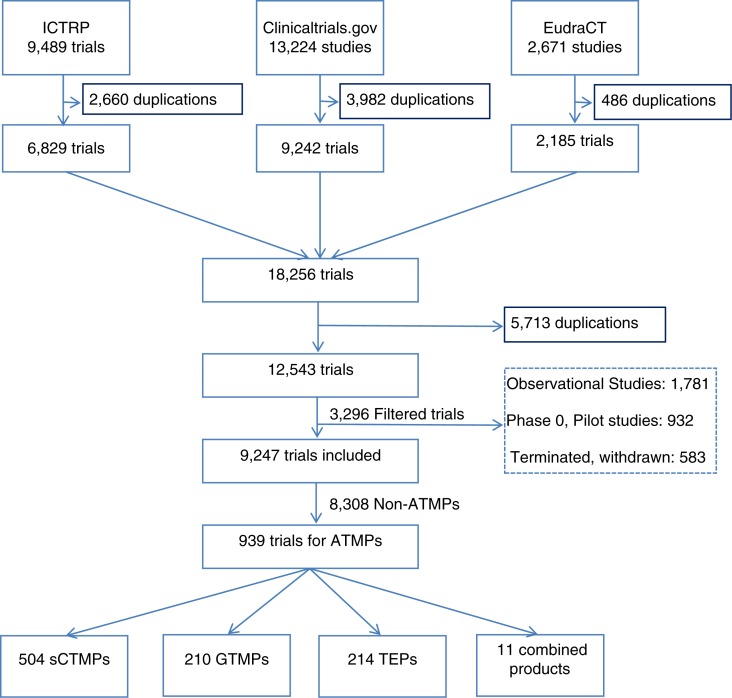
Fig. 1.
Flow chart of clinical trials identification and inclusion. This flow chart summarises the results obtained in each step of the study, starting by the database searches, the results after removing duplications from each database, then removing duplications from the combination of the results, including the filtered studies and the studies. ATMPs: advanced therapy medicinal products; sCTMPs: somatic cell therapy products; TEPs: tissue-engineered products; GTMPs: gene therapy medicinal products; ICTRP: International Clinical Trials Registry Platform.

