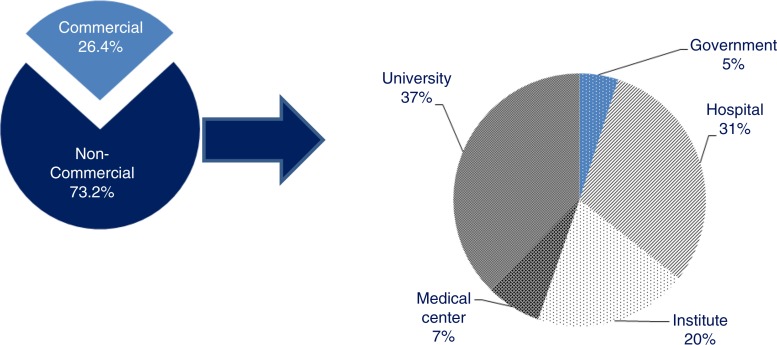
Fig. 5.
Distribution of the sponsors of ATMP clinical trials.
The first pie chart shows the distribution of the sponsors of ATMPs trials between commercial and non-commercial sponsors; the second pie chart shows the distribution of non-commercial sponsors between: university, medical centres, institutes, hospitals, and the government. Note: Sponsor was not specified in 0.4% of the trials.

