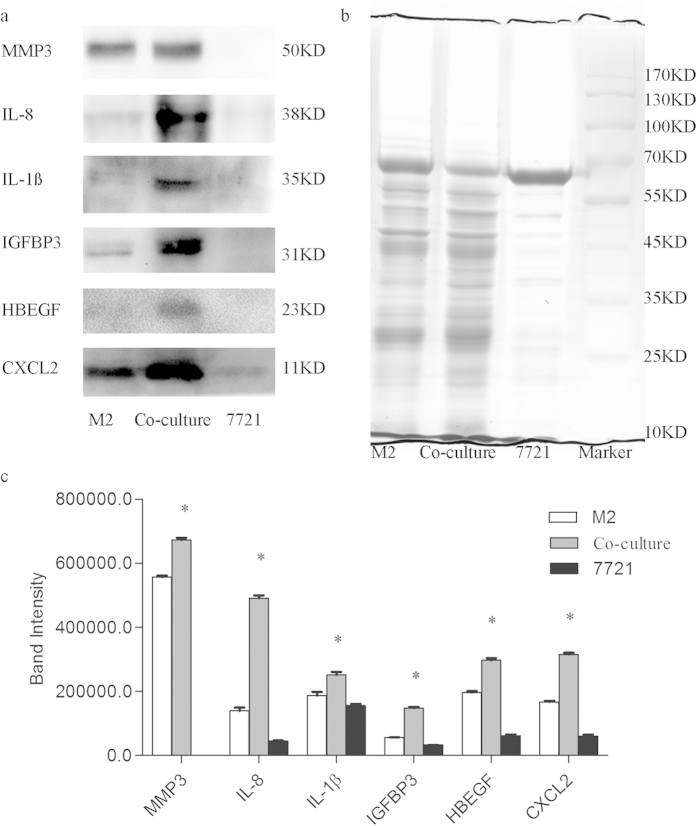
Figure 5. Expression analyses of the secreted proteins.
(a) Western blot was used to validated the differentially expressed proteins. All six proteins were expressed highest in the co-culture system, four (IL-8, IL-1ß, HBEGF, and IBP3) were completely coincident with the iTRAQ quantification trend, while MMP3 and CXCL2 were found to be more highly expressed in the M2 culture system than in the SMMC7721 culture system. (b) Coomassie staining. As all the samples were conditioned medium and β-actin or GAPDH can’t be used as reference to confirm equal protein loading (40 ug), coomassie staining was therefore used; it seems that less protein content of SMMC7721 cells was plotted, as compared to the M2 and Co-culture CM, maybe because the most abundant protein in all CM is albumin (the protein line at 60–70 kD), and CM of 7721 cells contains relative more albumin. (c) Bar graph of IL-8, MMP-3, IL-1ß, CXCL2, HBEGF and IBP3 based on densitometric analysis of western blot image and analyzed by Student’s t-test. *p < 0.05.

