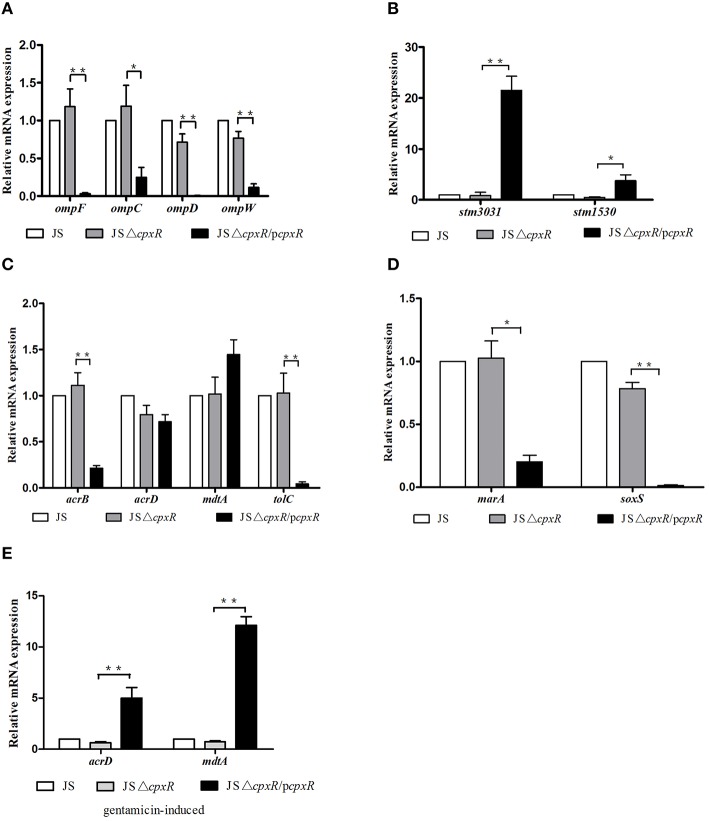
Figure 1.
Relative mRNA expression levels (n-fold) determined by real-time PCR. The expression level of each mRNA in strain JS represents 1-fold. The expression of the 16S rRNA gene was used as an internal control. Each bar represents the average value of three independent experiments. (A) Relative mRNA expression levels of the outer membrane proteins genes ompF, ompC, ompD, and ompW; (B) Relative mRNA expression levels of the outer membrane protein genes stm3031 and stm1530; (C) Relative mRNA expression levels of the efflux pumps genes acrB, acrD, mdtA, and tolC; (D) Relative mRNA expression levels of the transcription factor genes marA and soxS. (E) Relative mRNA expression levels of the efflux pump genes acrD and mdtA in all tested strains induced by GEN to the 15th passage at subinhibitory concentrations. *p < 0.05, **p < 0.01.

