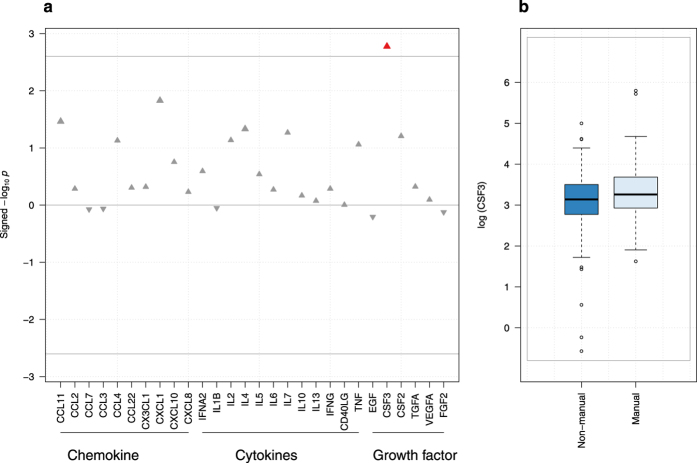
Figure 1.
(a) Plasma inflammatory factors study of father occupational position. The −log10 p-value is signed by the direction of the effect size estimate and is plotted against each of the 28 proteins. The grey line indicates the per-test significance level controlling the FWER at a 5% level. (b) Boxplot of log transformed CSF3 (or G-CSF) plasma levels per father occupational position group.

