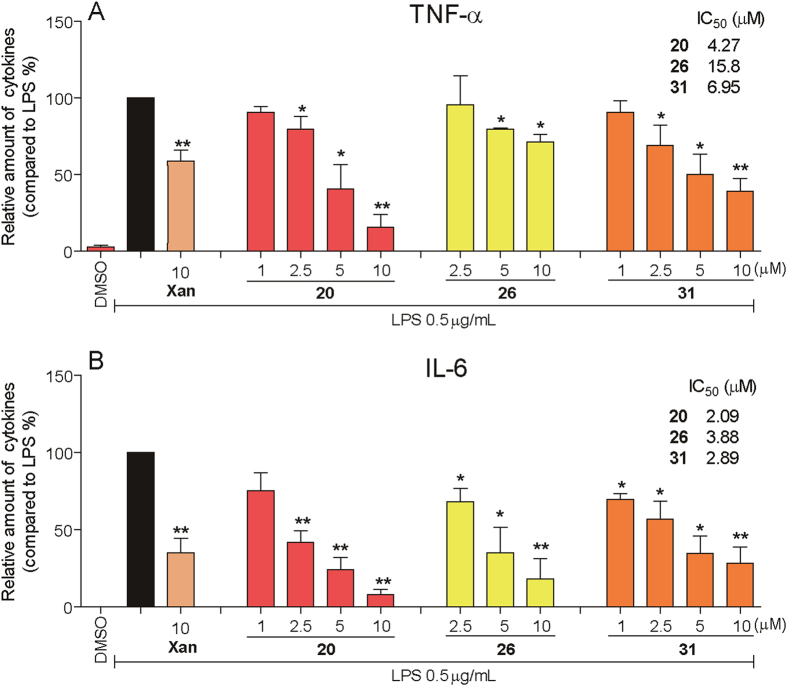
Figure 1. Inhibition of TNF-α and IL-6 production as indicated by chalcone derivatives.
After plating and 24 h of growth, cells were pretreated for 2 h with the indicated concentrations of each chalcone derivative before stimulated with LPS (0.5 μg/mL) for 22 h. Culture medium and proteins were then collected. The TNF-α and IL-6 levels in the medium were determined by ELISA. Data are expressed as fold change relative to control values (samples treated with LPS alone), mean ± SEM. n ≥ 3. *p < 0.05 and **p < 0.01 vs. only-LPS stimulated group.

