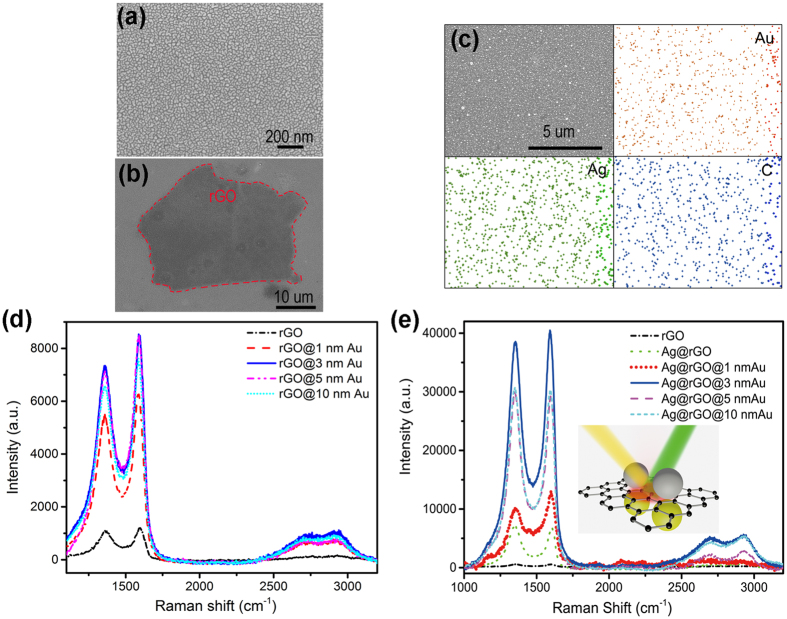
Figure 2.
(a) SEM image of Au nanostructures with detective thickness of 3 nm (Scale bar: 500 nm). (b) SEM image of the substrate of Ag@rGO@Au (Scale bar: 500 nm). The dark region within red line is the area with rGO nanospacer. Enhanced Raman spectra of rGO by different detective thicknesses of Au nanostructures. (c) The EDX imaging of Ag, Au and rGO (Red: gold. Green: silver. Blue: carbon). (d) Enhanced Raman spectra of rGO by different detective thicknesses of Au nanostructures. Inset: schematic of mechanism of G-SERS. (e) Enhanced Raman spectra of rGO by different detective thicknesses of Au nanostructures and 3 nm Ag nanostructures. Inset: schematic of mechanism of G-SERS.

