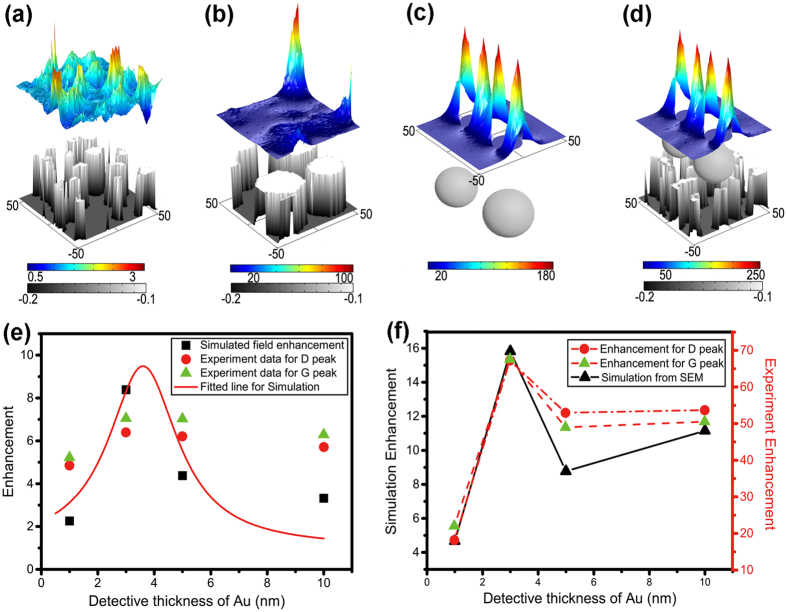
Figure 3. Simulated near-field enhancement and distribution for deep insight of mechanism of G-SERS.
The field enhancement is scaled in colors of rainbow and morphology of metal nanostructures is indicated by gray scale. The unit of axis is nm. (a) The simulated near-field distribution of Au nanostructures imported from SEM image with detective thickness of 3 nm. (b) The simulated near-field distribution of Ag nanostructures imported from SEM image with detective thickness of 3 nm. (c) The simulated near-field distribution of two Ag nanoparticles model for simplification of nanostructures in (b), with radius of 20 nm and gap of 10 nm. (d) The simulated near-field distribution of modeled Ag nanoparticles coupling with Au nanostructures imported from SEM image with detective thickness of 3 nm. (e) The experimentally measured D-peak (red dots) and G-peak (green triangle) of enhancement of G-SERS on the substrate of rGO@Au and the simulated enhancement of electromagnetic field of Au nanostructure by importing the SEM image (black square). The solid line is the fitted curve of the simulation results. (f) The measured enhancements of D-peak (red dots) and G-peak (green triangle) on the substrate of Ag@rGO@Au and simulated near-field (black square) of hybrid structures of modeled Ag nanoparticles (radius: 20 nm, gap: 10 nm) on Au nanostructures in (e).

