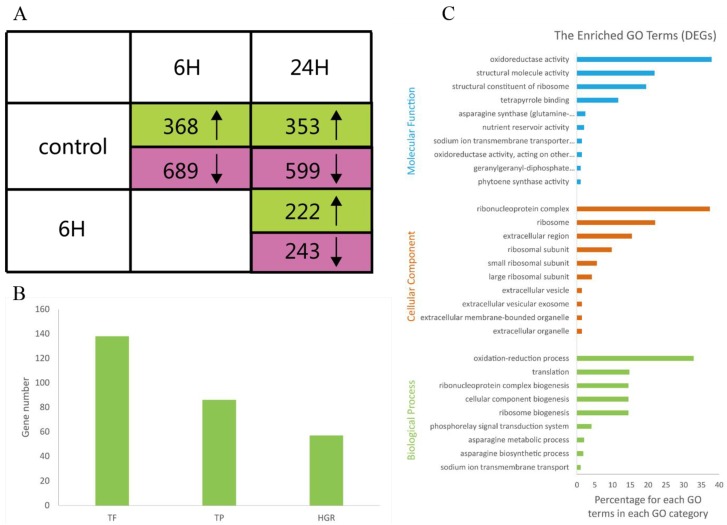
Figure 2.
Transcriptomes analysis of A. splendens with three comparisons: (i) 6 vs. 0 h; (ii) 24 vs. 0 h; and (iii) 24 vs. 6 h. (A) Numbers of DEGs that were upregulated (green) and downregulated (pink) in the three comparisons (FDR <0.001; upregulated: fold change >2; and downregulated: fold change <0.5); (B) numbers of total DEGs and DEGs annotated as transcription factors (TFs), transporter proteins (TPs), and hormone-related genes (HRGs); and (C) GO terms that were overrepresented among the DEGs (color figure online).

