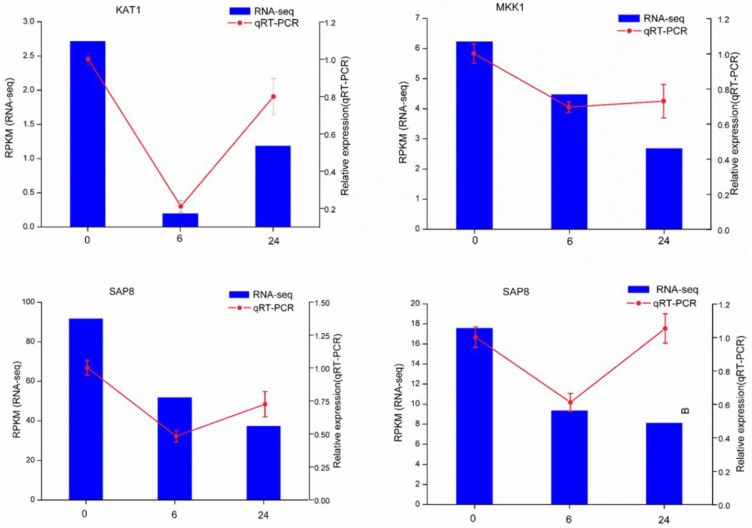
Figure 5.
qRT-PCR verification of four selected DEGs. Comparison of RNA-seq data (blue bar) with qRT-PCR data (red line). The normalized RNA-seq expression levels (RPKM) are indicated on the y-axis to the left. The relative qRT-PCR expression levels are indicated on the y-axis to the right. The EF1A gene was used as an internal control. The results of both methods are consistent, with similar gene expression patterns (color figure online).

