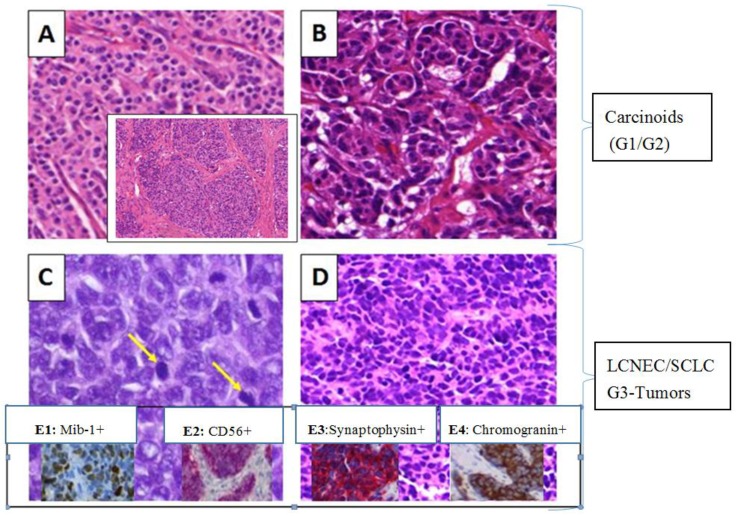
Figure 1.
H&E (A–D) as well as IHC (E1–E4) stained specimens of four different NET subtypes of the lung. Typical carcinoid (A); atypical carcinoid (B); large cell neuroendocrine carcinoma (C); and small cell lung carcinoma (D) are shown (MiraxDesk scanned). Yellow arrows indicate high mitotic rates. (E1–E4) IHC markers: (E1) LCNEC, MIB-1 analysis (tumor cell proliferation rate); (E2) LCNEC, positive for CD56; (E3) SCLC, positive for synaptophsin; and (E4) LCNEC, positive for chromogranin (MiraxDesk scanned).

