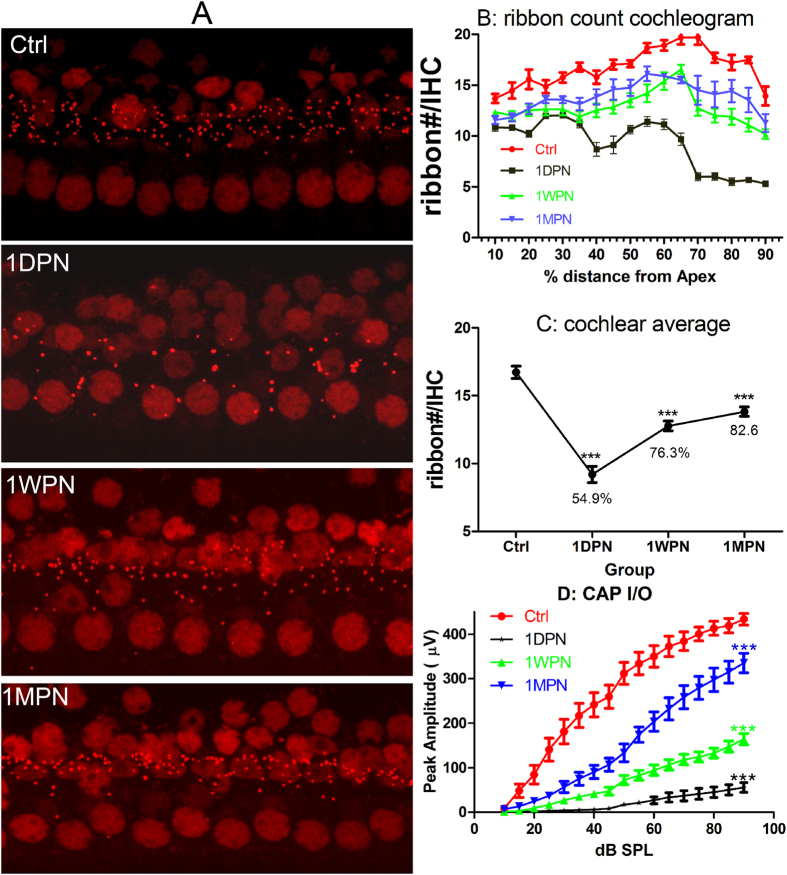
Figure 1. Noise induced changes in ribbon density (ribbon#/IHC) and click evoked CAP amplitude.
(A) representative images showing ribbon changes by the noise exposure. (B) ribbon#/IHC cochleogram. (C) the changes of overall ribbon density after noise (% was calculated against the value of control). (D) Click-evoked CAP input-output functions. A one-way ANOVAs were performed on the overall ribbon density changes and the CAP amplitude measured at 90 dB SPL. Both showed significant effects of noise. The significance was indicated by the asterisks as the result of post-hoc pairwise tests against the control. ***p < 0.001.

