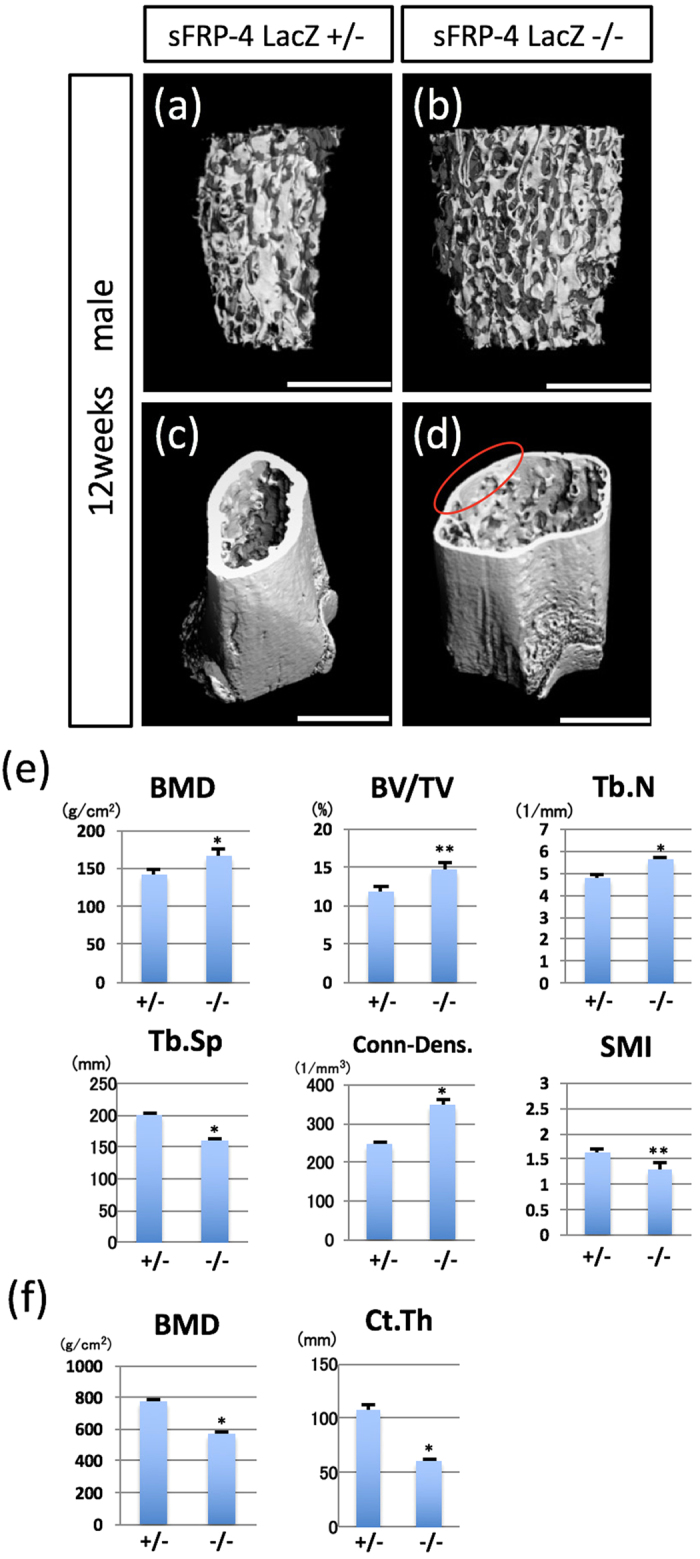
Figure 2. Abnormal bone formation induced by targeted inactivation of the sFRP4 gene.

(a–d) Representative 3D μCT images of the distal femurs of sFRP4 LacZ/+ and sFRP4 LacZ/LacZ mice at 12 weeks of age. μCT images of trabecular bone (a,b) and cortical/trabecular bone (c,d). Note increased trabecular mass (b) and reduced cortical width ((d) red circle) in sFRP4 LacZ/LacZ mice. (e) Quantification of Bone mineral density (BMD), Bone volume fraction (BV/TV), Trabecular number (Tb.N), Trabecular spacing (Tb.Sp), Connectivity density (Conn-Dens) and Structure model index (SMI) of trabecular bone of distal femurs. (f) Quantification of Bone mineral density (BMD) and Cortical thickness (Ct.Th) of cortical bone of distal femurs. Bone structural parameters in sFRP4 LacZ/LacZ mice show the buildup of trabecular bone and the weakening of cortical bone. Results of all quantitative analysis (e,f) are consistent with 3D μCT images (a–d). Error bars indicate the means ± SD (n=5); means ± SD in BMD: 40.87 ± 7.87 for +/− and 166.09 ± 8.58 for −/−, BV/TV: 11.84 ± 0.58 for +/− and 14.85 ± 0.88 for −/−, Tb.N: 4.82 ± 0.09 for +/− and 5.68 ± 0.07 for −/−, Tb.Sp: 199.33 ± 5.06 for +/− and 161 ± 2.72 for −/−, Conn-Dens: 249.04 ± 3.30 for +/− and 348.96 ± 11.48 for −/−, SMI: 1.63 ± 0.08 for +/− and 1.3 ± 0.12 for −/−, cortical BMD: 771.66 ± 13.9 for +/− and 569.03 ± 14.07 for −/−, Ct.Th: 107.47 ± 4.78 for +/− and 61.1 ± 1.42 for −/−. Statistical significance was determined by paired Student’s t-test. *P < 0.01 and **P < 0.05 versus sFRP4 LacZ +/−. Bars 1000 μm (a–d).
