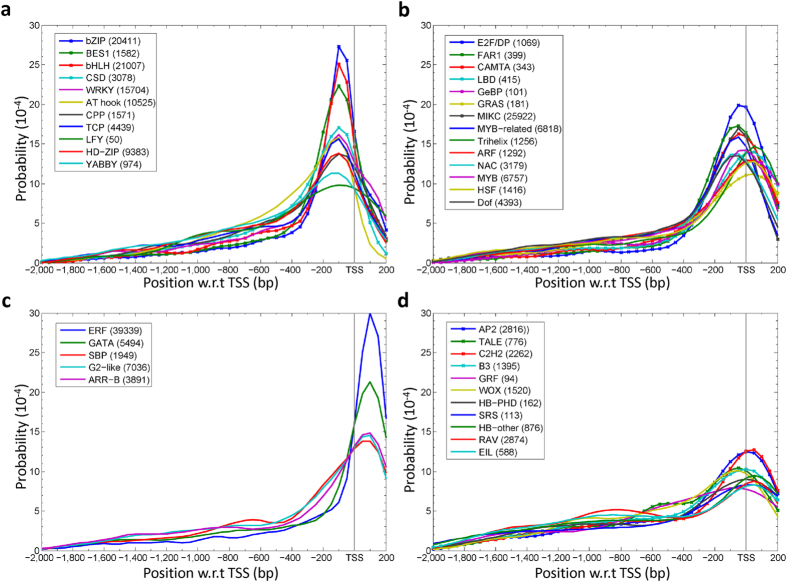
Figure 2. Positional distribution of TFBS in a TF family.
A total of 41 distributions are shown and categorized by their peaks and the kurtoses. (a) Positional distributions of TFBSs in each of 11 TF families with the distribution peak located at <−100 bp w.r.t TSS and a kurtosis >0, which means a sharper distribution than the normal distribution, which has kurtosis = 0. (b) Positional distributions of TFBSs in each of 14 TF families with a distribution peak within the region from −100 bp to TSS and a kurtosis >0. (c) Positional distributions of TFBSs in each of 5 TF families with the distribution peak within the region from TSS to +200 bp and a kurtosis >0. (d) Positional distributions of TFBSs for each of 11 TF families with a kurtosis <0. For each TF family, the total number of TFBS occurrences is indicated in the parentheses. The vertical line in each diagram represents the position of the TSS.

