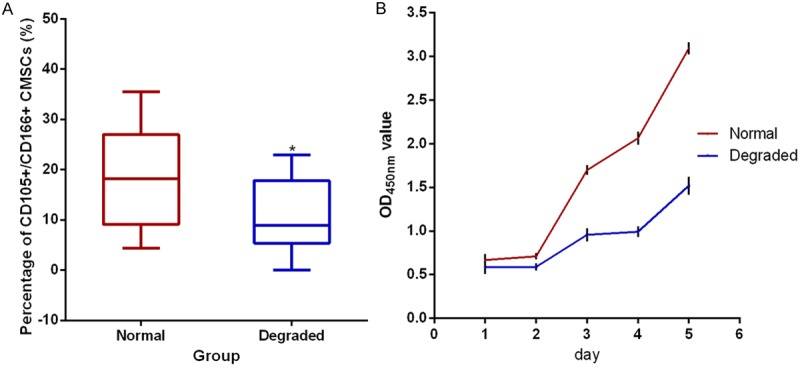
Figure 2.

The percentage (A) and proliferation rate (B) of CD105+/CD166+ cartilage-derived mesenchymal stem cells (CMSCs) in the degraded and normal cartilage. (A) The percentage of CD105+/CD166+ CMSCs is analyzed by fluorescence-activated cell sorting (n=10) and compared by paired t-test. Data are presented as the median (horizontal bar), 25th and 75th percentiles (boxes), extrema (error bars), *P<0.05. (B) The proliferation rate of CD105+/CD166+ CMSCs tested by CCK-8 assay (n=5) and presented as the mean ± SEM.
