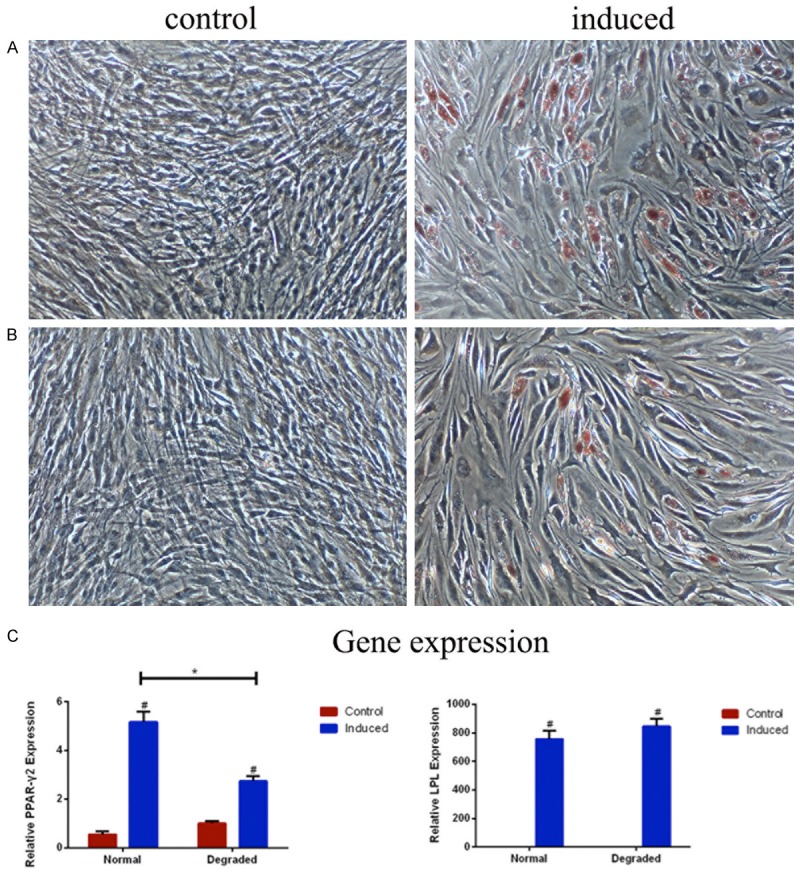
Figure 4.

Adipogenic differentiation of CD105+/CD166+ cartilage-derived mesenchymal stem cells (CMSCs) in normal (A) and degraded (B) cartilage. (A and B) Adipogenic differentiation cells are induced using adipogenic induction medium (right imgae ×100), control cells are cultured in MSC growth medium (left image ×100), and cells are stained by oil-red-O after 21 days (n=3). (C) The expressions of PPAR-γ2 and LPL mRNA are analyzed by RT-PCR (n=3). #P<0.05 compared with control cells from the same group, *P<0.05 compared with induced cells from the normal group. Data are presented as the mean ± SEM.
