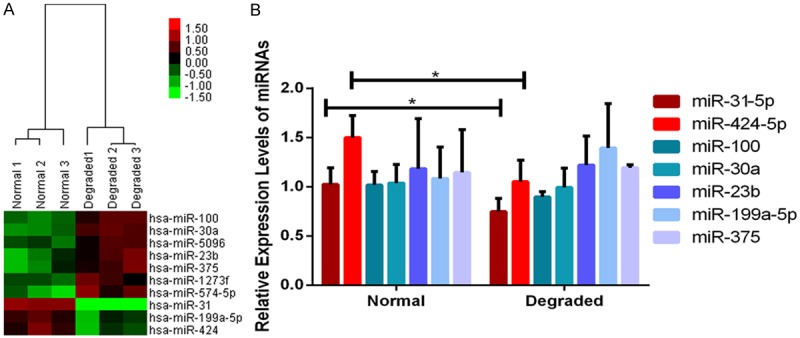
Figure 6.

Clustering analysis (A) and validation (B) of significantly differentially expressed miRNAs in cartilage-derived mesenchymal stem cells (CMSCs) between Normal and Degraded cartilage. (A) Two-dimensional cluster diagram of 10 significantly differentially expressed miRNAs. Columns represent individual donor samples, and each row represents individual assayed miRNA. Down-regulation of miRNAs is in green, and up-regulation of miRNAs is in red. (B) Validation of 7 candidate miRNAs (n=3). Significantly lower expression of miR-31-5p and miR-424-5p in CMSC from the Degraded cartilage are confirmed by real-time PCR, *P<0.05, data are presented as the mean ± SEM.
