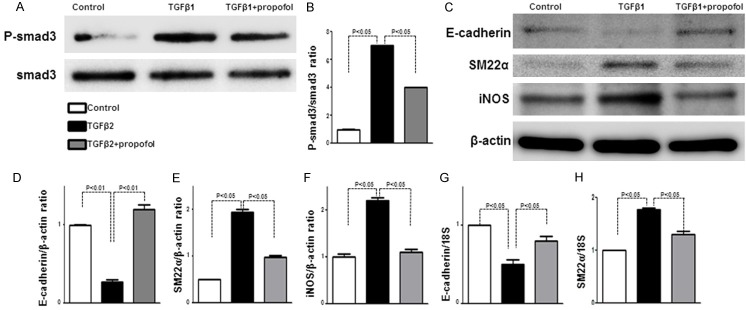
Figure 4.
Propofol inhibits EMT and iNOS in HK-2 cells. A. Western blot analysis of p-Smad3 in HK-2 cells. Representative data from four bands per group are shown. B. Densitometric analysis of p-Smad3 normalized to Smad3 (n = 4 per group). Data are the means ± SEM. C. Western blot analysis of E-cadherin, SM-22α, and iNOS in HK-2 cells. D-F. Densitometric analysis of E-cadherin, SM-22α, and iNOS normalized to β-actin (n = 4 per group). Data are the means ± SEM. G. qPCR analysis of E-cadherin in HK-2 cells. H. qPCR analysis of SM-22α in HK-2 cells.

