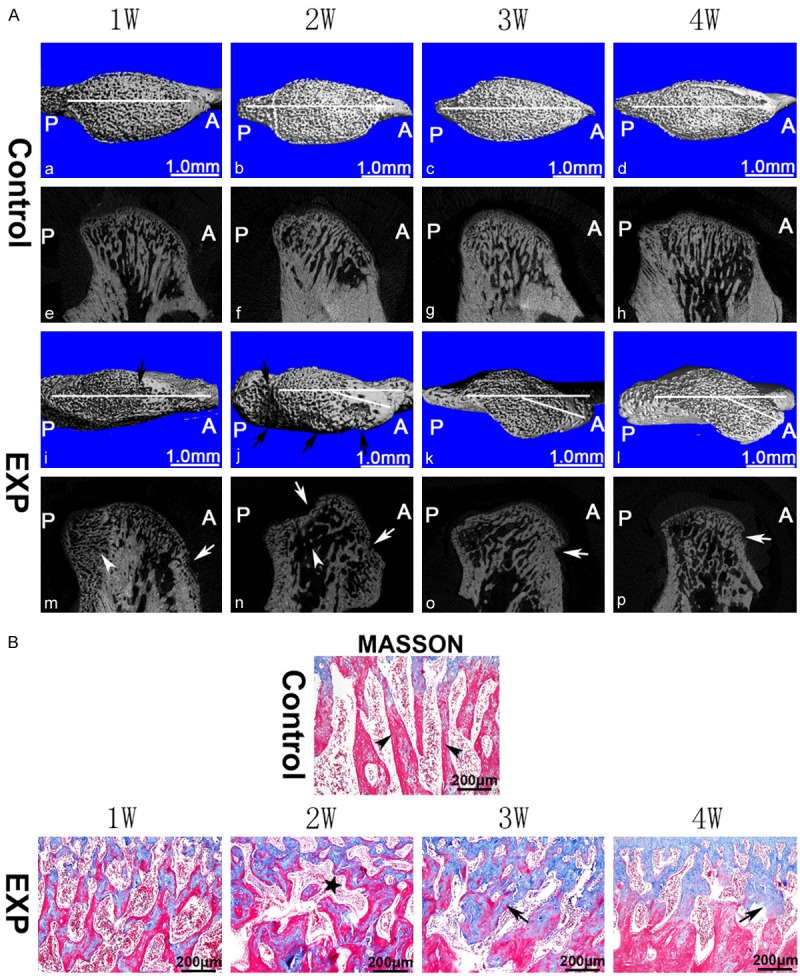
Figure 3.

Bony changes in TMJ condyle. (A) Images were arranged from left to right according to the time sequence. In the control group (a-h), the subchondral bone was regularly aligned. Subchondral bone loss (arrows) was observed in the experimental groups (i-p). Generally, regions with lesion were larger (j, n) at 2 weeks than those at other time points. Compared with the control groups (a-d), the 3- and 4-week experimental groups showed obvious atypical condyle shape that deviated from the normal sagittal axis (k, l) based on the 3D reconstruction image. (B) In the control group, normal trabecular bone were long, parallel to each other, and radially perpendicular to the articular surface (arrow head); in the experimental groups, irregular and disordered trabecular bone structure was observed particularly at 3 and 4 weeks (black arrows). The asterisk represents subchondral bone marrow cavity. EXP: experiment, A: anterior, P: posterior. White horizontal line: sagittal axis used for analysis.
