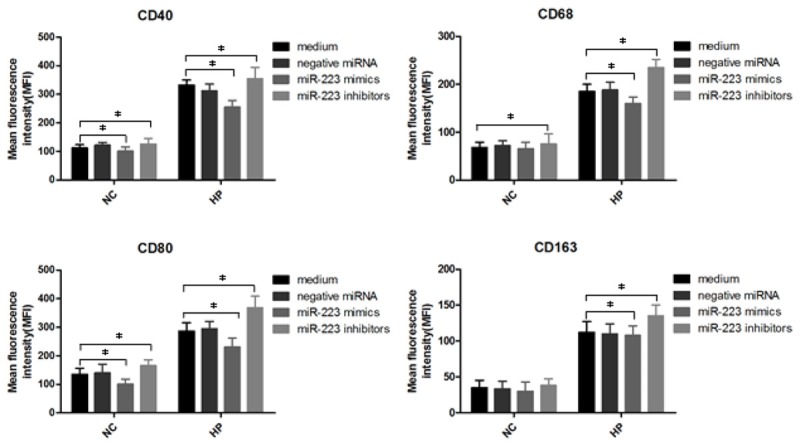
Figure 4.

Analysis of surface CD40, CD68, CD80 and CD163 on H. pylori infected macrophages with siRNA treatment. H. pylori infected macrophages were first treated with negative miRNA, miR-223 mimics or miR-223 inhibitors, and then 106 cells were analyzed by flow cytometry. Bar graphs show the mean fluorescence intensities (MFI) of CD40, CD68, CD80 and CD163. Data shown are mean ± SEM of 3 independent experiments (*P≤0.05).
