
Figure 4.
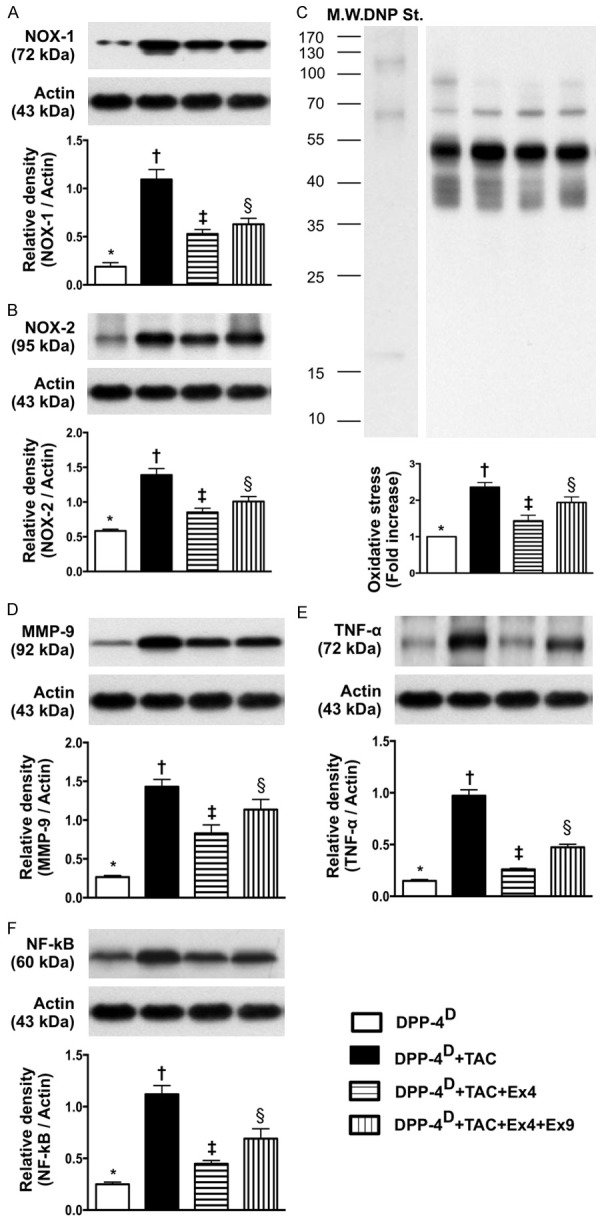
Protein expressions of oxidative stress and inflammatory biomarkers in myocardium by day 60 after transverse aortic constriction (TAC) procedure (n = 10). A. Protein expression of NOX-1, * vs. other groups with different symbols (*, †, ‡, §), p < 0.0001. B. Protein expression of NOX-2, * vs. other groups with different symbols (*, †, ‡, §), p < 0.001. C. The oxidized protein expression, * vs. other groups with different symbols (*, †, ‡, §), p < 0.001. (Note: left lanes shown on the upper panel represent protein molecular weight marker and control oxidized molecular protein standard, respectively). M.W = molecular weight; DNP = 1-3 dinitrophenylhydrazone. D. Protein expression of matrix metalloproteinase (MMP)-9, * vs. other groups with different symbols (*, †, ‡, §), p < 0.0001. E. Protein expression of tumor necrosis factor (TNF)-α, * vs. other groups with different symbols (*, †, ‡, §), p < 0.001. F. Protein expression of nuclear factor (NF)-α, * vs. other groups with different symbols (*, †, ‡, §), p < 0.001. All statistical analyses were performed by one-way ANOVA, followed by Bonferroni multiple comparison post hoc test. Symbols (*, †, ‡) indicate significance (at 0.05 level). DPP-4D = dipeptidyl peptidase-4 deficiency; Ex4 = exendin-4; Ex9 = exendin-9-39; HPF = high-power field.