
Figure 5.
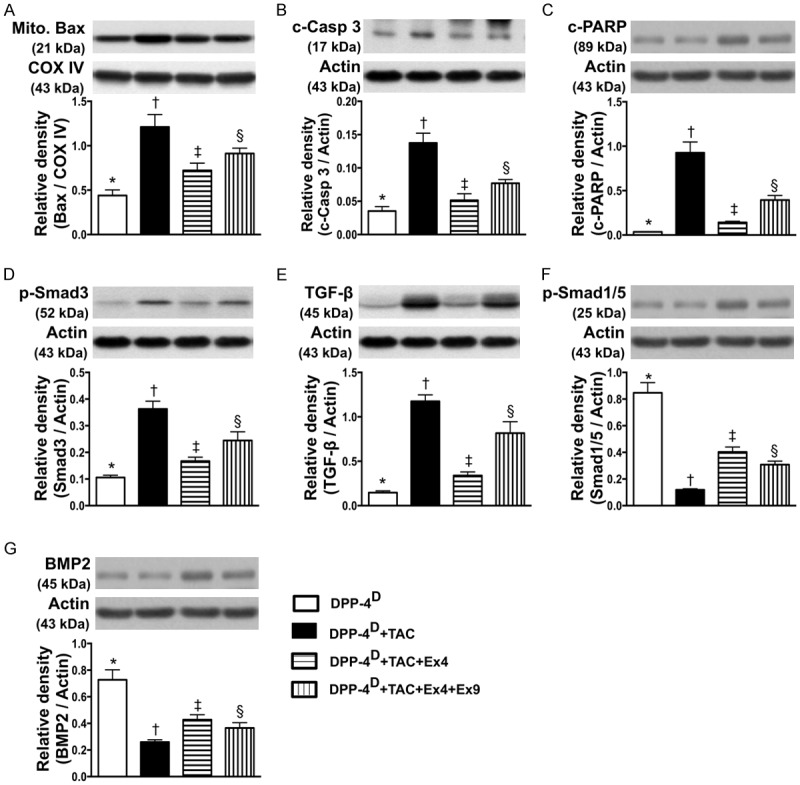
Protein expressions of apoptosis, fibrosis and anti-fibrotic biomarkers in myocardium by day 60 after TAC procedure (n = 10). A. Protein expression of mitochondrial Bax, * vs. other groups with different symbols (*, †, ‡, §), p < 0.001. B. Protein expression of cleaved (c) caspase 3, * vs. other groups with different symbols (*, †, ‡, §), p<0.001. C. Protein expression of cleaved poly (ADP-ribose) polymerase (c-PARP), * vs. other groups with different symbols (*, †, ‡, §), p < 0.0001. D. Protein expression of phosphorylated (p)-Smad3, * vs. other groups with different symbols (*, †, ‡, §), p < 0.001. E. Protein expression of transforming growth factor (TGF)-β, * vs. other groups with different symbols (*, †, ‡, §), p < 0.0001. F. Protein expression of p-Samd1/5, * vs. other groups with different symbols (*, †, ‡, §), p < 0.0001. G. Protein expression of bone morphogenesis protein (BMP)-2, * vs. other groups with different symbols (*, †, ‡, §), p < 0.0001. All statistical analyses were performed by one-way ANOVA, followed by Bonferroni multiple comparison post hoc test. Symbols (*, †, ‡) indicate significance (at 0.05 level). DPP-4D = dipeptidyl peptidase-4 deficiency; Ex4 = exendin-4; Ex9 = exendin-9-39; HPF = high-power field.