
Figure 6.
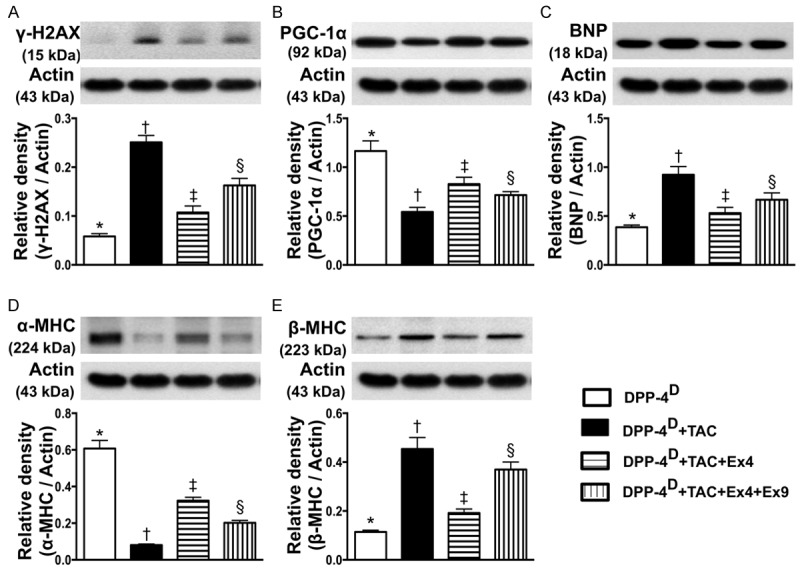
Protein expressions of myocardial damage and pressure-overload biomarkers in myocardium by day 60 after TAC procedure (n = 10). A. Protein expression of γ-H2AX, * vs. other groups with different symbols (*, †, ‡, §), p < 0.001. B. Protein expression of peroxisome proliferatoractivated receptor gamma coactivator-1α (PGC-1α), * vs. other groups with different symbols (*, †, ‡, §), p < 0.001. C. Protein expression of brain natriuretic peptide (BNP), * vs. other groups with different symbols (*, †, ‡, §), p < 0.001. D. Protein expression of alpha myosin heavy chain (α-MHC), * vs. other groups with different symbols (*, †, ‡, §), p < 0.0001. E. Protein expression of β-MHC, * vs. other groups with different symbols (*, †, ‡, §), p < 0.001. All statistical analyses were performed by one-way ANOVA, followed by Bonferroni multiple comparison post hoc test. Symbols (*, †, ‡) indicate significance (at 0.05 level). DPP-4D = dipeptidyl peptidase-4 deficiency; Ex4 = exendin-4; Ex9 = exendin-9-39; HPF = high-power field.