
Figure 8.
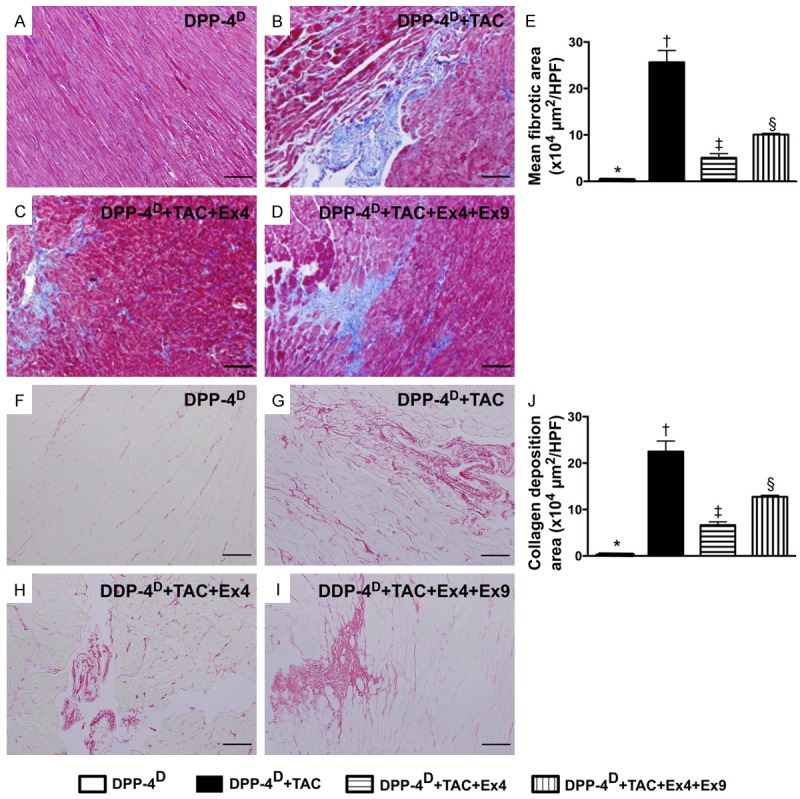
Microscopic findings of fibrotic area and collagen deposition area in myocardium by day 60 after TAC procedure (n = 10). A-D. Microscopic finding (100x) Mason’s trichrome staining for identification of fibrotic area. E. Results of statistical analysis, * vs. other groups with different symbols (*, †, ‡, §), p < 0.0001. The scale bars in right lower corner represent 100 µm. F-I. Microscopic finding (200x) of Sirius red staining for identification of collagen deposition area. J. Results of statistical analysis, * vs. other groups with different symbols (*, †, ‡, §), p < 0.0001. The scale bars in right lower corner represent 50 µm. All statistical analyses were performed by one-way ANOVA, followed by Bonferroni multiple comparison post hoc test. Symbols (*, †, ‡) indicate significance (at 0.05 level). DPP-4D = dipeptidyl peptidase-4 deficiency; Ex4 = exendin-4; Ex9 = exendin-9-39; HPF = high-power field.