
Figure 9.
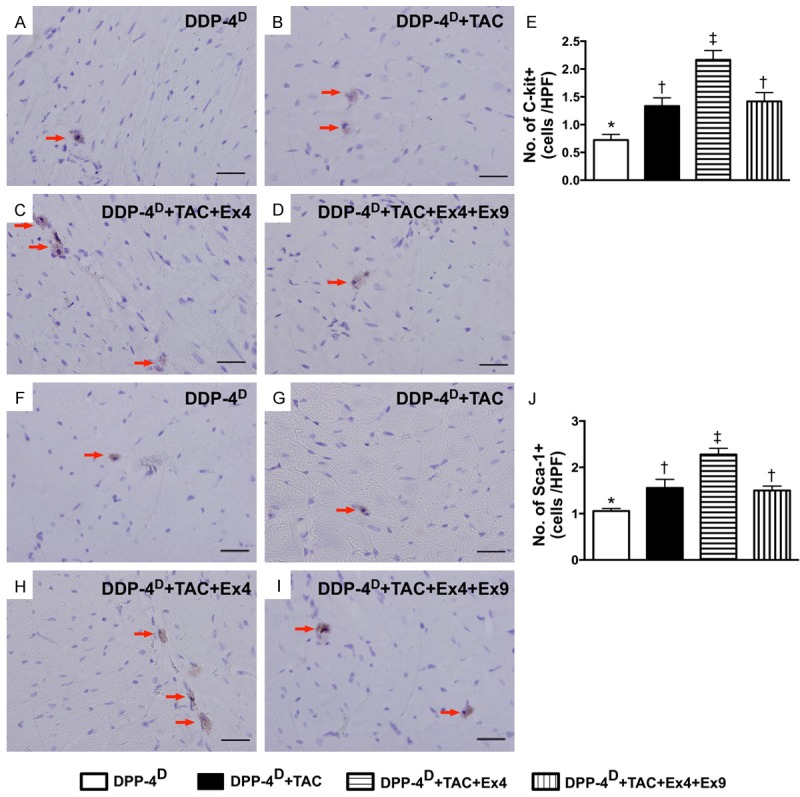
Immunohistochemical (IHC) staining for cardiac stem cells in myocardium by day 60 after TAC procedure (n = 10). A-D. Microscopic (400x) finding of IHC staining for identifying the number of c-Kit+ cells (red arrows). E. Results of statistical analysis, * vs. other groups with different symbols (*, †, ‡), p < 0.001. The scale bars in right lower corner represent 20 µm. F-I. Microscopic (400x) finding of IHC staining for identifying the number of Sca-1+ cells (red arrows). J. Results of statistical analysis, * vs. other groups with different symbols (*, †, ‡), p < 0.001. The scale bars in right lower corner represent 20 µm. All statistical analyses were performed by one-way ANOVA, followed by Bonferroni multiple comparison post hoc test. Symbols (*, †, ‡) indicate significance (at 0.05 level). DPP-4D = dipeptidyl peptidase-4 deficiency; Ex4 = exendin-4; Ex9 = exendin-9-39; HPF = high-power field.