
Figure 10.
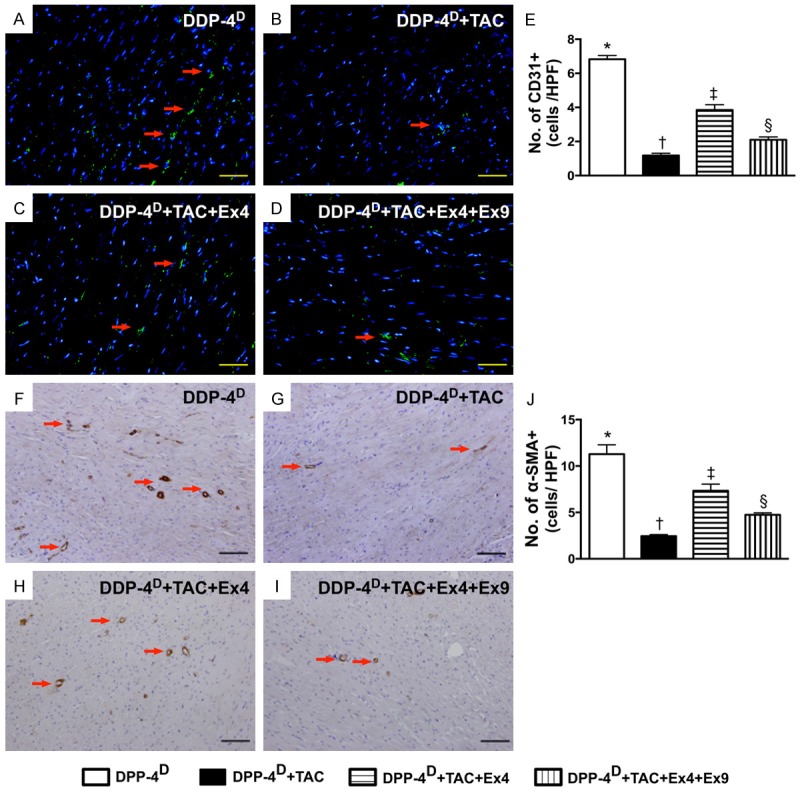
Angiogenesis in myocardium by day 60 after TAC induction (n = 10). A-D. Immunofluorecent microscopic (200x) finding for identifying the number of CD31+ cell (green color). E. Results of statistical analysis, * vs. other groups with different symbols (*, †, ‡, §), p < 0.001. The scale bars in right lower corner represent 50 µm. F-I. Microscopic (100x) finding of IHC staining (i.e., α-smooth muscle actin positive stain) for identifying the number of small vessels (≤ 25 µM) (red arrows). J. Results of statistical analysis, * vs. other groups with different symbols (*, †, ‡, §), p < 0.0001. The scale bars in right lower corner represent 100 µm. All statistical analyses were performed by one-way ANOVA, followed by Bonferroni multiple comparison post hoc test. Symbols (*, †, ‡) indicate significance (at 0.05 level). DPP-4D = dipeptidyl peptidase-4 deficiency; Ex4 = exendin-4; Ex9 = exendin-9-39; HPF = high-power field.