
Figure 11.
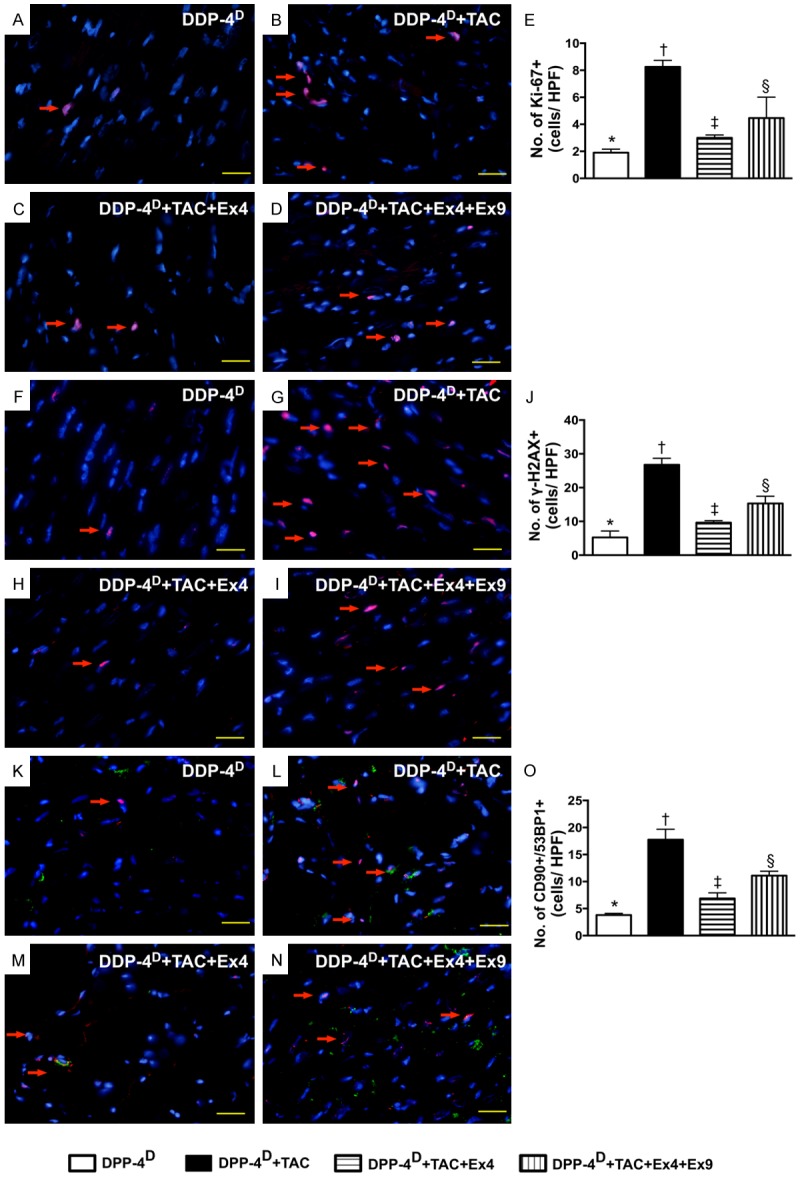
Immunofluorecent (IF) staining of DNA damage biomarkers in myocardium by day 60 after TAC induction (n = 10). A-D. IF microscopic (400x) finding for identifying the numbers of Ki-67+ cells (red color). E. Results of statistical analysis, * vs. other groups with different symbols (*, †, ‡, §), p < 0.0001. The scale bars in right lower corner represent 20 µm. F-I. IF microscopic (400x) finding for identifying the numbers of γ-H2AX+ cells (red color). J. Results of statistical analysis, * vs. other groups with different symbols (*, †, ‡, §), p < 0.001. The scale bars in right lower corner represent 20 µm. K-N. IF microscopic (400x) finding for identifying the numbers of double stained CD90+/53BP1+ cells (green-reddish color). O. Results of statistical analysis, * vs. other groups with different symbols (*, †, ‡, §), p < 0.001. The scale bars in right lower corner represent 20 µm. All statistical analyses were performed by one-way ANOVA, followed by Bonferroni multiple comparison post hoc test. Symbols (*, †, ‡) indicate significance (at 0.05 level). DPP-4D = dipeptidyl peptidase-4 deficiency; Ex4 = exendin-4; Ex9 = exendin-9-39; HPF = high-power field.