
Figure 12.
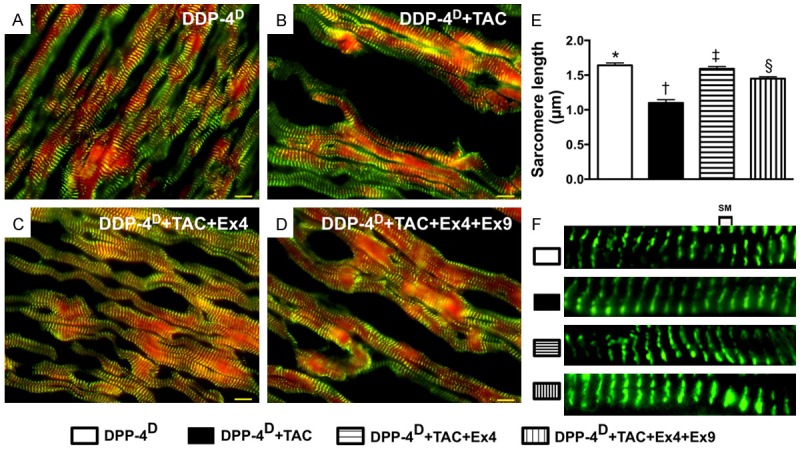
Actinin-phalloidin staining for measuring the sarcomere length of cardiomyocytes by day 60 after TAC procedure (n = 10). A-D. IF microscopic (600x) finding for identifying the sarcomere length. E. Results of statistical analysis, * vs. other groups with different symbols (*, †, ‡, §), p < 0.0001. The scale bars in right lower corner represent 10 µm. F. Illustrating the measurement (magnified A-D) of distance of sarcomere length. SM = sarcomere. All statistical analyses were performed by one-way ANOVA, followed by Bonferroni multiple comparison post hoc test. Symbols (*, †, ‡) indicate significance (at 0.05 level). DPP-4D = Dipeptidyl peptidase-4 deficiency; Ex4 = exendin-4; Ex9 = exendin-9-39.