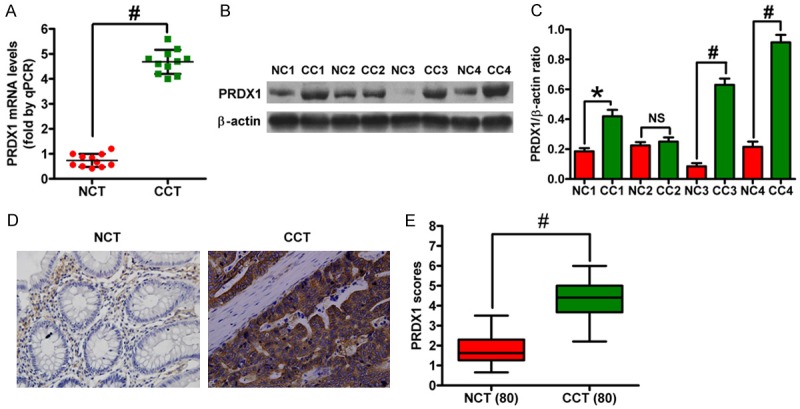
Figure 3.

mRNA and protein levels of PRDX1 in CRC and paired control tissues were assessed by qPCR, western blot, and IHC. A. Expression of PRDX1 mRNA in the four pairs of CRC and control tissue samples by qPCR. B. Expression of PRDX1 protein in the four pairs of CRC and control tissue samples by western blot analysis. β-actin was used as a loading control. C. Relative density of PRDX1 normalized to β-actin. D. Representative images showing the expression of PRDX1 in tissues by IHC. E. Scores of PRDX1-positive staining. All figures are representative of three independent experiments performed in triplicate. Data are expressed as means ± SD. Statistical significance: *P < 0.05 vs NCT groups; #P < 0.01 vs NCT groups. (NCT: non-cancerous tissue; CCT: colon cancer tissue).
