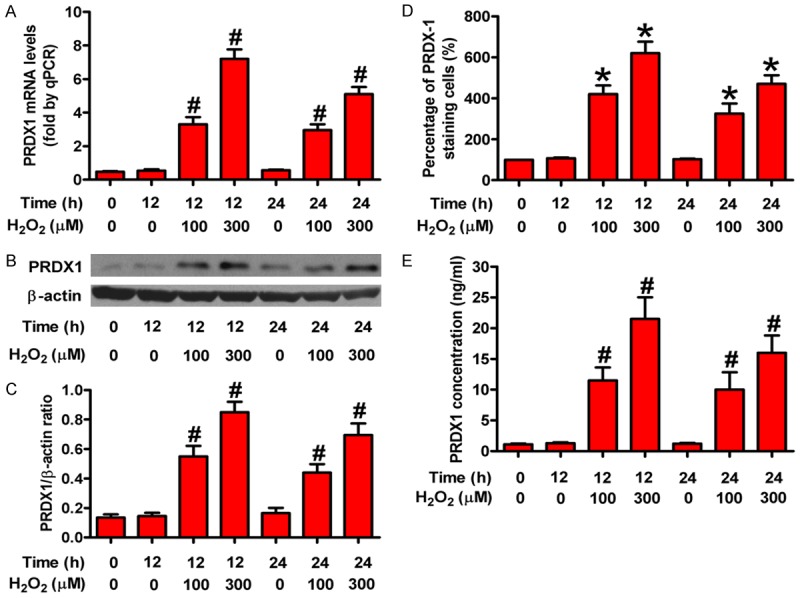
Figure 5.

Oxidative stress caused PRDX1 upregulation in vitro. NCM460 cells were incubated with different doses of H2O2 (0 μM, 100 μM, and 300 μM) for 0 h, 12 h, and 24 h, respectively. Expression changes of PRDX1 were determined by qPCR, western blot, immunocytochemical staining, and ELISA. (A) qPCR analysis of PRDX1 mRNA expression in NCM460 cells treated with various doses of H2O2 at indicated time points. (B) Representative results of PRDX1 expression in each group analyzed by western blot. (C) Relative quantity of PRDX1 normalized to β-actin. (D and E) PRDX1 expression was examined in NCM460 cells treated with H2O2 compared with mock-treated NCM460 by immunocytochemical staining (D) and ELISA (E). All figures are representative of three independent experiments performed in triplicate. Data are expressed as means ± SD. Statistical significance: *P < 0.05 vs H2O2-free groups; #P < 0.01 vs H2O2-free groups.
