
Figure 1.
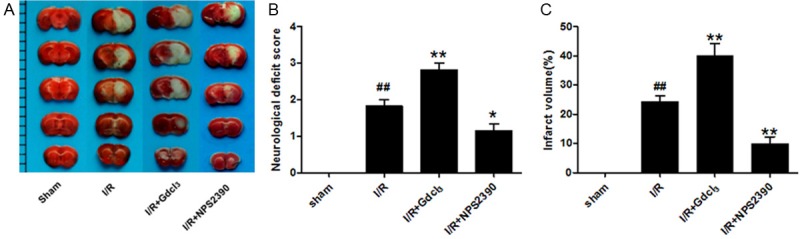
The cerebral infarct volume and neurological function in different groups. A. TTC-staining of brain slices (2 mm for each scale); B. Quantitative analysis of cerebral infarct volume; C. Quantitative analysis of neurological function. a: Sham group, b: I/R group, c: I/R + Gdcl3 group, d: I/R + NPS2390 group (n = 6 per group). ##P<0.01 vs sham group; *P<0.05, **P<0.01 vs I/R group.